Abstract
The study of past human dispersion is a central topic to understand how humans occupied the planet. However, this is not a simple task, as it depends on our ability to estimate the ancestral state of past populations based on the biological diversity observed among samples, before this can be used to infer phylogenetic relationships between them. Studies dedicated to this type of analysis rely on understanding the forces that structured the variance between and within the groups studied. For complex phenotypic data, like cranial morphological variation, this task is especially challenging due to the combination of factors that contributed to the observed pattern of variance among modern human groups. In this chapter, I explore the structure of the morphological variance within and between Asian regions, to illustrate the importance of considering the myriad of evolutionary forces structuring the morphological variance among regions when reconstructing past human dispersion. Using a large craniometric dataset representing three Asian macro-regions, I compare, through the estimation of QST values, the apportionment of variance in Asia and compare it to the values obtained for other regions of the planet. The results are contextualized within four continent-wide periods of human dispersion. Taken together, they suggest that Asia’s morphological diversity is mostly defined by a geographic structure, same as the rest of the planet, but there are significant departures from this pattern when analyzing Northeast Asia. This analysis shows that local conditions can impact significantly the structure of morphological variance and must be considered in the reconstruction of past dispersion events.
Introduction
One of the main challenges faced by scientists interested in the study of modern humans’ past is the reconstruction of the pathways by which human populations dispersed across different geographic areas over time. Hundreds of articles have been published in the last decade alone dedicated to the discussion about the colonization of and dispersion over larger continental areas, testing and/or defending different migration hypotheses or dispersion scenarios. There is no doubt that this type of inquiry has been at the core of our efforts to understand the origin of modern human biological and cultural diversity. The most fundamental challenge for these studies lies in the fact that, invariably, we are reconstructing past populations dynamics by studying samples that do not directly belong to the populations that were involved in the migration or dispersion process; they only represent the descendants of the individuals involved in those dispersion events. Even studies working with prehistoric remains rarely—if ever—are able to assess the characteristics of the populations that were involved in the demic diffusion process of interest. As such, the study of past human dispersion events relies on the analysis of the structure of variance observed in descendant populations, more specifically on the partitioning of the observed variance that results from differences between-groups and of individual variations within-groups.
The structure of variance between and within-groups has been the basis of studies about past human dispersion events because its analysis permits the inference of the origins of such variance and, consequently, the reconstruction of the probable biological history of the populations sampled. For example, differences between groups (also referred to biological distances or biodistances) have been frequently used to explore biological affinities between populations in the past (e.g., Hanihara 1996; Howells 1989; Neves and Hubbe 2005) and have also been used to test specific hypotheses of possible dispersion models. Frequently, this is done by associating such biological distances with specific evolutionary forces causing them, like for example patterns of gene flow over time or space (e.g., Harvati and Weaver 2006; Hubbe, Harvati, and Neves 2011; Reyes-Centeno et al. 2015; von Cramon-Taubadel 2009; von Cramon-Taubadel, Strauss, and Hubbe 2017). Ultimately, however, the common denominator in all these studies is the assumption (implicit or explicit) that the evolutionary forces structuring the variance observed in the populations sampled are well understood, and therefore they allow for the derivation of the population’s ancestral characteristics (i.e., their evolutionary history).
Therefore, the structure of human phenotypic (and genetic) variance between and within-populations is a key aspect in the study of past human population dynamics (e.g., Relethford 1994; Roseman 2004; von Cramon-Taubadel 2009; von Cramon-Taubadel and Weaver 2009), as it forms the basis for any exploratory or model bound analysis of past population movements, and informs the ways by which human groups occupied and adapted to different geographic regions in the planet. Succinctly, the structure of phenotypic variance results from different evolutionary forces that regulate the origin, spread, and maintenance of variance over time. In the case of complex phenotypic traits, such as cranial morphology, the way by which specific genetic, developmental and environmental factors interact to produce the final cranial shape of any given individual is still largely unknown (e.g., Hallgrímsson et al. 2007; Klingenberg 2014), but the structure of the variance among and within groups (i.e., the relative distances among them) has been shown to be correlated to (and in some cases to be the result of) several quantifiable phenomena, ranging from stochastic evolutionary processes, like genetic drift and isolation by distance, to natural selection to specific environmental pressures or even cultural practices that regulate gene flow between populations (e.g., Galland et al. 2016; González-José et al. 2005; von Cramon-Taubadel, 2014). These phenomena, when combined, result in specific patterns of partitioning of the variance observed between and within populations, resulting in the relative biological differences between them. The differences (i.e., biological distances) between groups are then used as theoretical assumptions in studies focused on understanding the biological affinities and relationships among populations in the past.
The assumptions derived from this approach are frequently used to test null hypotheses, in which the biological distance represents the expected divergence from a common ancestor under random evolutionary processes like genetic drift. In that way, the departure from expectation of these neutral null hypotheses permits the discussion of other factors that may explain the distances observed. For instance, there is a vast literature dealing with the reliability of using cranial morphological differences to reconstruct major aspects of human dispersion across the planet (e.g., Betti et al. 2009; Carson 2006; Harvati and Weaver 2006; Hubbe, Hanihara, and Harvati 2009; Relethford 1994, 2004; Roseman 2004; Smith 2009; von Cramon-Taubadel and Weaver 2009), given the importance of these data to assess the biological characteristics of populations from regions or timeframes of interest, especially in cases where access to direct genetic information is limited. This discussion has been particularly present in the last couple of decades, as the study of morphological affinities has become a central component in the study of past human mobility, playing a major role in the discussions about the human occupation of Asia (e.g., Hanihara 1996; Harvati 2009; Reyes-Centeno et al. 2015), Europe (e.g., Pinhasi and von Cramon-Taubadel 2012), Australo-Melanesia (e.g., Schillaci 2008), the Americas (e.g., de Azevedo et al. 2011; Strauss et al. 2015; von Cramon-Taubadel et al. 2017), and Polynesia (e.g., Valentin et al. 2016), not to mention studies focused on smaller geographical regions. Understanding the evolutionary forces that structure the accumulation and maintenance of phenotypic differences between populations is therefore essential to build well-informed models and hypotheses that can be tested with morphological data. Understandably, a stronger knowledge about the evolutionary forces responsible for the partitioning of variance between populations leads to stronger predictive models, which in turn can be used to construct more accurate explanations for interpreting the patterns of human dispersion in the past. Therefore, resolving the source of the variance partitioning, including the interactions between genotype, environment, development and phenotype, among modern humans is a necessary step for the study of past human dispersion.
Evolutionary forces shaping morphological variance
The discussion about the sources of cranial morphological variance partitioning has been especially focused on the role that non-directional evolutionary forces have played in shaping the modern human morphological variation worldwide. While the structure of variance between and within populations depends both on the development of new variance (for example, through mutations or admixture with other demes) and on the redistribution of the variance (through, for example, gene flow and genetic drift), the discussion about the structure of cranial morphological variance among modern humans has been focused almost exclusively on the latter. Given the developmental constrains during the growth of cranial structures, as well as the different degrees of integration between its anatomical modules (see review in Lieberman 2011), the acquisition of new variance through mutations is considered negligible when compared to the magnitude of differences that can be accumulated from the unequal redistribution of the available variance across populations. For these reasons, most of the studies focused on the origins of morphological variance among modern humans have concentrated on distinguishing neutral from non-neutral micro-evolutionary forces (e.g., Betti et al. 2009; Harvati and Weaver 2006; Hubbe et al. 2009; Relethford 2004; Roseman 2004; Smith 2009).
Some of the most impactful studies in this sense are those that support the idea that morphological variance is structured according to stochastic events, like serial bottlenecks or isolation by distance. Most of these studies compare morphological data to the patterns of variance observed in neutral molecular markers or with specific predictions of differentiation over time and space that derive from neutral evolutionary models (e.g., Betti et al. 2009; Relethford 2004; Roseman 2004; von Cramon-Taubadel and Weaver 2009). What makes these studies so relevant for the reconstruction of past human dispersion is the fact that they allow to quantify the impact of evolutionary forces structuring morphological variance (and distances between-groups) that are relatively linear over time and space. In other words, they allow reconstructing the ancestral conditions of the populations studied through linear relationships that are not dependent on specific extrinsic factors. As long as the morphological distances between populations are largely the result of stochastic events, it is expected that geographic or temporal distances between series will be linearly correlated with gene flow between populations, since gene flow will be reduced over space and time through a combination of events like isolation by distance or serial founder effects. As this depends only on intrinsic factors of the sample studied (i.e., the way by which total variance is structured between and within populations), several studies have used this assumption to test dispersion scenarios among past populations (e.g., Hubbe, Neves, and Harvati 2010; Pinhasi and von Cramon-Taubadel 2012; Reyes-Centeno et al. 2015; Strauss et al. 2015).
Non-stochastic factors, on the other hand, pose a significant challenge to studies of past human dispersions. Non-stochastic factors, like natural selection to extremely cold environments (Harvati and Weaver 2006; Hubbe et al. 2009), or adaptive responses to changes in diet and subsistence (Galland et al. 2016; González-José et al. 2005) have been identified in several regions of the planet and are responsible for significant portions of the cranial phenotypic variance partitioning (i.e., relative distances among populations). However, while they are undeniably important components of the origin of modern human morphological variance, their context-dependent nature makes them harder, if not impossible, to be included in models of past human dispersion processes. Consequently, the magnitude and direction of responses under non-stochastic forces are dependent largely on factors that are not intrinsic to the populations studied, like environmental oscillations, technological innovations or even social constrains, and these factors are rarely known in enough detail to permit their incorporation in models that infer the ancestral condition of the populations studied. These factors limit significantly our ability to create accurate models of dispersion across space and time, since they limit the reconstruction of the ancestral states of populations, or the time and distance that separate modern populations from last common ancestors. In other words, they break the assumption of linear accumulation of differences between populations since their last common ancestor and can result in incorrect reconstructions of population history. Therefore, when biological distances are used to reconstruct routes of population dispersion, the presence of non-stochastic events affecting some of the clades in the analysis can result in the evolutionary relationship of populations being incorrectly quantified. For example, under strong stabilizing selection, clades will remain more similar over time than expected under neutral models, while under directional selection, clades will accumulate differences faster over time than under stochastic events. Unless properly quantified, this departure from linear associations between biological differences in ancestral-descendant relationships can generate distorted reconstruction of past events, by suggesting relationships between groups that are artificial and that may mask the real evolutionary history between populations. Although non-stochastic factors have been argued to be of less importance on larger geographic scales (e.g., Evteev et al. 2014; Relethford 2004; Roseman 2004; von Cramon-Taubadel 2011), several studies in the past have claimed that they can be important enough as to deem studies of biological affinities between populations unreliable (e.g., Carlson and Van Gerven 1979).
Similar to non-stochastic evolutionary forces, other factors can disrupt the linear expectation between biological distances and ancestor-descendant relationships. Of particular interest to the context of this chapter are disruptions caused by multiple dispersion events into specific regions, where the latter migrations may partially or completely erase the previous dispersions. In these cases, early dispersion events can be completely invisible from the morphological data (in cases of full replacement), or can add considerable noise to the biological distances among populations (in case of partial assimilation of earlier populations’ variance), and therefore also produce artificial evolutionary relationships between the populations analyzed. Despite the fact that multiple dispersion events characterize the occupation of most, if not all, larger regions of the planet, most studies of morphological diversity among modern humans tend to assume that the process of human dispersion is the result of a single dispersion wave or that the geneflow between populations was constant over time and space. This is a necessary assumption in most cases, since the incorporation of multiple dispersion events requires knowledge that is extrinsic to the populations studied, and that varies from region to region, similar to what happens in cases where non-stochastic evolutionary forces acted on morphological diversity.
The main point of this brief discussion is to illustrate that understanding how the variance among modern humans is structured (i.e., what is producing the biological distances observed among them) is a central aspect to reconstruct past population dispersion events, which at the same time is essential for reconstructing the pathways by which our species expanded and occupied the planet. Even if most studies do not acknowledge this explicitly, all studies of human dispersion over space and time depend on accurate reconstructions of ancestral states of the populations being studied to establish the last common ancestor between groups of interest, which in turn allows establishing phylogenetic relationships between them. Only when accurate phylogenetic relationships have been established, can this information be contrasted with the spatial or temporal characteristics of the studied series to infer the dispersion patterns that gave origin to them. In other words, they all rely on accurate assumptions of evolutionary forces that structured the observed variance between and within populations.
In this chapter, I will explore the structure of the cranial morphological variance in Asia, contrasting it with what is observed in other continents and macro-regions, to contribute to the discussion about the evolutionary forces structuring morphological variance among modern human populations. I have two main goals with this analysis. The first one is to test the hypothesis that modern human morphological variation is structured similarly across the planet, i.e., that we can assume that the relationship between morphological distances and ancestral-descendant relationships are largely linear across the planet. As introduced above, this is a central assumption in several studies that explore the morphological diversity across larger regions of the planet, and a better understanding of the similarities and differences in the ways that variance is partitioned across regions can contribute to studies of past human migration.
My second goal is to look more specifically at the impact that different evolutionary forces and dispersion events played in the partitioning of morphological variance among different regions of Asia, in order to contribute to our understanding of how much the unique history of Asia’s human occupation is reflected in the larger pattern of human morphological diversity. For this end, I derive some expectations from four major events of dispersion that characterize the human presence in Asia, and contrast them to the partitioning of variance among Asian regions. I focus on four major stages that may have caused widely spread and long-lasting impacts on the structure of Asian morphological variance (i.e., on the pattern of relative biological distances among populations). These stages are evidently simplistic and clearly cannot be considered as an exhaustive review of the human dispersion across Asia. They were selected because they can be translated into predictions to be contrasted against the craniometric data available for this study.
Modern human dispersions across Asia
Asia is an interesting continent to focus for the analysis of modern human dispersion for a series of complementary reasons. First, it represents the largest continent on the planet, encompassing around 30% of the world’s landmasses, and presents a wide range of ecological zones, several of them (e.g., subarctic and high-altitude areas) far outside the original conditions under which our species evolved. Second, the history of the human occupation and dispersion across the Asian continent has been a major focus of recent archaeological, anthropological, linguistic and genetic research, as well illustrated by the contributions presented in this volume. Moreover, the human dispersion across Asia is of relevance not only for understanding the processes that allowed human population to successfully colonize the immense ecological diversity of the continent, but also because the occupation of Asia played a key role in the human dispersion across the planet during the end of the Pleistocene. And finally, Asia went through several stages of broad human dispersion that may have changed the structure of the morphological diversity among modern human populations over time across large portions of the continent. As such, the process of human occupation of Asia’s vastly different geographic and ecological regions was marked by complex patterns of mobility and interaction between human groups in the past.
Broadly speaking, Asia’s history can be divided into four large moments of population expansion, which have contributed to the modern biological makeup of Asian populations. Each of them represents events that are unique to the continent, and a better understanding of them allows to answers the question of how much of the morphological variance seen in Asia is structured in ways similar to what is observed in other regions of the planet, and how much of it is unique to this continent.
The first main stage of human dispersion in Asia is represented by the original expansion of modern humans from Africa into this continent. Asia was occupied by modern humans very early (~130-70 kyr; Lahr 1996; Mellars 2006; Mellars et al. 2013; Reyes-Centeno et al. 2014) when compared to the occupation of other non-African continents. The initial dispersion into Asia kept the human populations within the environmental range of tropical and subtropical regions, possibly following a coastal route (Petraglia et al. 2010; Reyes-Centeno et al. 2014), which promoted an eastward dispersion. This initial wave out of Africa is marked by a strong initial genetic bottleneck (Betti et al. 2009; Manica et al. 2007), followed by serial founder-effects, resulting in a loss of average genetic and morphological diversity as populations colonized regions farther away from Africa. However, early Asian populations met and probably admixed with multiple hominin groups that were previously inhabiting Asia (Teixeira and Cooper 2019), resulting in a potential influx of genetic variance back into Asian populations. From a cranial morphological point of view, the early populations expanding out of Africa seem to have retained the same ancestral morphological patterns of the earliest African modern humans, so early Asian specimens tend to be closer morphologically to Late Pleistocene specimens in Africa, Europe and Australia (Harvati 2009; Hubbe et al. 2011) than to most modern Asian populations. This earlier morphological pattern was mostly replaced during later periods, although isolated populations throughout Southeast Asia have been described as retaining the earlier morphology (Lahr 1996; Reyes-Centeno et al. 2015). Although this stage represents an important step in the human occupation of Asia, the evidence that only a few of the modern populations are their direct descendants suggests that there will not be a strong impact of this stage in the structure of variance observed among recent Asian populations. This initial dispersion event follows the expected pattern of isolation by distance and serial bottle-necks, and as such would be expected to leave similar signatures in the apportionment of variance as would be seen in other larger areas occupied by humans in the past. However, it is possible that admixture with hominin groups already occupying Asia during this period would result in an influx of genetic diversity into modern human populations residing where these encounters happen. Moreover, if they were frequent enough, this would result in a deviation from linear patterns, as a result of morphological differences between groups increasing faster than what would be expected under stochastic models.
The second stage of occupation is associated with subsequent dispersion waves out of Africa, which followed the initial colonization of the continent. While the suggestion of multiple dispersions into Asia is not supported by some autosomal studies (HUGO Pan-Asian SNP Consortium et al. 2009; Reich et al. 2011), several archaeological, genetic, and craniometric studies (Mellars 2006; Rasmussen et al. 2011; Reyes-Centeno et al. 2014) find support for this scenario. This second stage of dispersion may have followed quickly after the first one, starting as early as 50 thousand years ago, and is associated with both an eastward path across the continent and probably with the occupation of more temperate zones. The expansion waves following the initial occupation of Asia seem to have remained largely separated from earlier populations, as there is little evidence of admixture between them (Rasmussen et al. 2011; Reyes-Centeno et al. 2014). While there is not enough archaeological evidence at this point to refine the chronological timeframe of this expansion, or even to answer questions about the routes taken by them (see Reyes-Centeno et al. 2014; Reyes-Centeno et al. 2015 for a longer discussion), this expansion wave occupied larger portions of the continent, following the same pattern of serial founder-effects and isolation by distance from Africa proposed for the earliest expansions into the continent. Probably, this is the event that shaped most strongly the morphological diversity seen in the Asian continent, given the geographic structure of modern Asian populations (HUGO Pan-Asian SNP Consortium et al. 2009), and as such is the stage that is expected to have the largest impact on the current structure of Asian cranial morphological variance.
A third important stage in the human dispersion across Asia relates to the occupation of higher latitudes, which may have started as early as 35 kyr (e.g., Jacobs et al. 2019). The expansion into higher latitudes and colder environments marks an important feat for modern human populations, as it represents the expansion into ecological zones that humans are not able to survive without technological advances that permit them to conquer these harsh environments. The expansion into colder climates occurred much later than the initial occupation of Australia, for example, and was also the last step required before humans could settle the Americas and occupy all the large continents in the planet. Such challenges are reflected as well in the genetic diversity of northern Asian populations, since there is a clear clinal structure of decreasing genetic diversity from south to north in the continent (HUGO Pan-Asian SNP Consortium et al. 2009). From the point of view of morphological variance, the dispersion towards higher latitudes is an important stage in the structuring of morphological variance, since craniometric studies have demonstrated a strong adaptive response in populations occupying the extreme cold of high latitude environments (Evteev et al. 2014; Harvati and Weaver 2006; Hubbe et al. 2009). As such, the occupation of higher latitudes is associated with the first strong departure from a purely isolation by distance pattern that is assumed to have structured the morphological variance in Asia until then. The adaptive response to cold climate promoted an increase in the morphological distances between populations, particularly in anatomical regions of the skull associated with the regulation of internal body temperature, like the neurocranium and the nasal region (Hubbe et al. 2009).
The final stage that is important in the context of this chapter is the increased mobility and gene flow experienced in large portions of Asia during the second half of the Holocene. The domestication of horses, the creation of long-distance trade routes, like the Silk Road, and the spread of the larger civilizations in East and South Asia may have had a significant impact in increasing gene flow across Asia, decreasing the amount of variance that is a result of differences between groups (i.e., making populations more similar to each other). This larger degree of connection across Asia is supported by historical and linguistic documentation (e.g., Hansen 2012), as well as genetic evidence. Although there is a clear pattern of genetic structure based on geography and language groups in the continent (HUGO Pan-Asian SNP Consortium et al. 2009), a large proportion of Asian Y-chromosome diversity has been shown to derive from a very small number of male individuals who lived between 4 and 2 kyr BP (Balaresque et al. 2015; Zerjal et al. 2003), supporting the quick spread of genetic lineages across Asia. The expectation that is derived from this period of increased population movement is that some of the previous variance structure will be diluted or even erased, as gene flow across large distances will diminish the amount of variance that is a result of differences between groups.
Together, these four stages combine several different processes associated with human dispersion across the continent and illustrate how population movement may have affected the current structure of local morphological variance. While some of them probably acted in conjunction, structuring variance between and within groups in similar ways (stages 1 and 2), others acted counter to this initial structure, creating possible deviations associated with increased variance (stage 3) or decreasing distances between groups (stage 4). As such, these stages create a series of expectations that can be tested against the morphological data analyzed in this chapter:
- The first stage of human dispersion would have created a strong geographic structure to morphological variance in the continent, due to serial founder effects and bottlenecks from Africa. This would result in strong correlations between morphological distances and geographic distances. On the other hand, this is the stage where admixture with other hominins population was probably most frequent, which could inflate the amount of variance that is due to differences between groups. However, it is also possible that the signal form this dispersion event was largely erased by the subsequent dispersions of the second stage.
- The second stage of human dispersion would also be highly geographically structured and would result in the morphological diversity of Asia reflecting patterns seen in other parts of the planet, following the expectations from isolation by distance and sequential bottleneck processes.
- The third stage probably resulted in a strong climate signal on the structure of variance in Asia, as natural selection to cold environments would result in inflated morphological distances between populations from cold and warmer environments.
- Finally, the fourth stage acted as a homogenizing event, decreasing the differences among populations as gene-flow was facilitated by technological advancements and large demic expansions late in the Holocene.
Material & methods: Quantifying cranial morphological variance in Asia
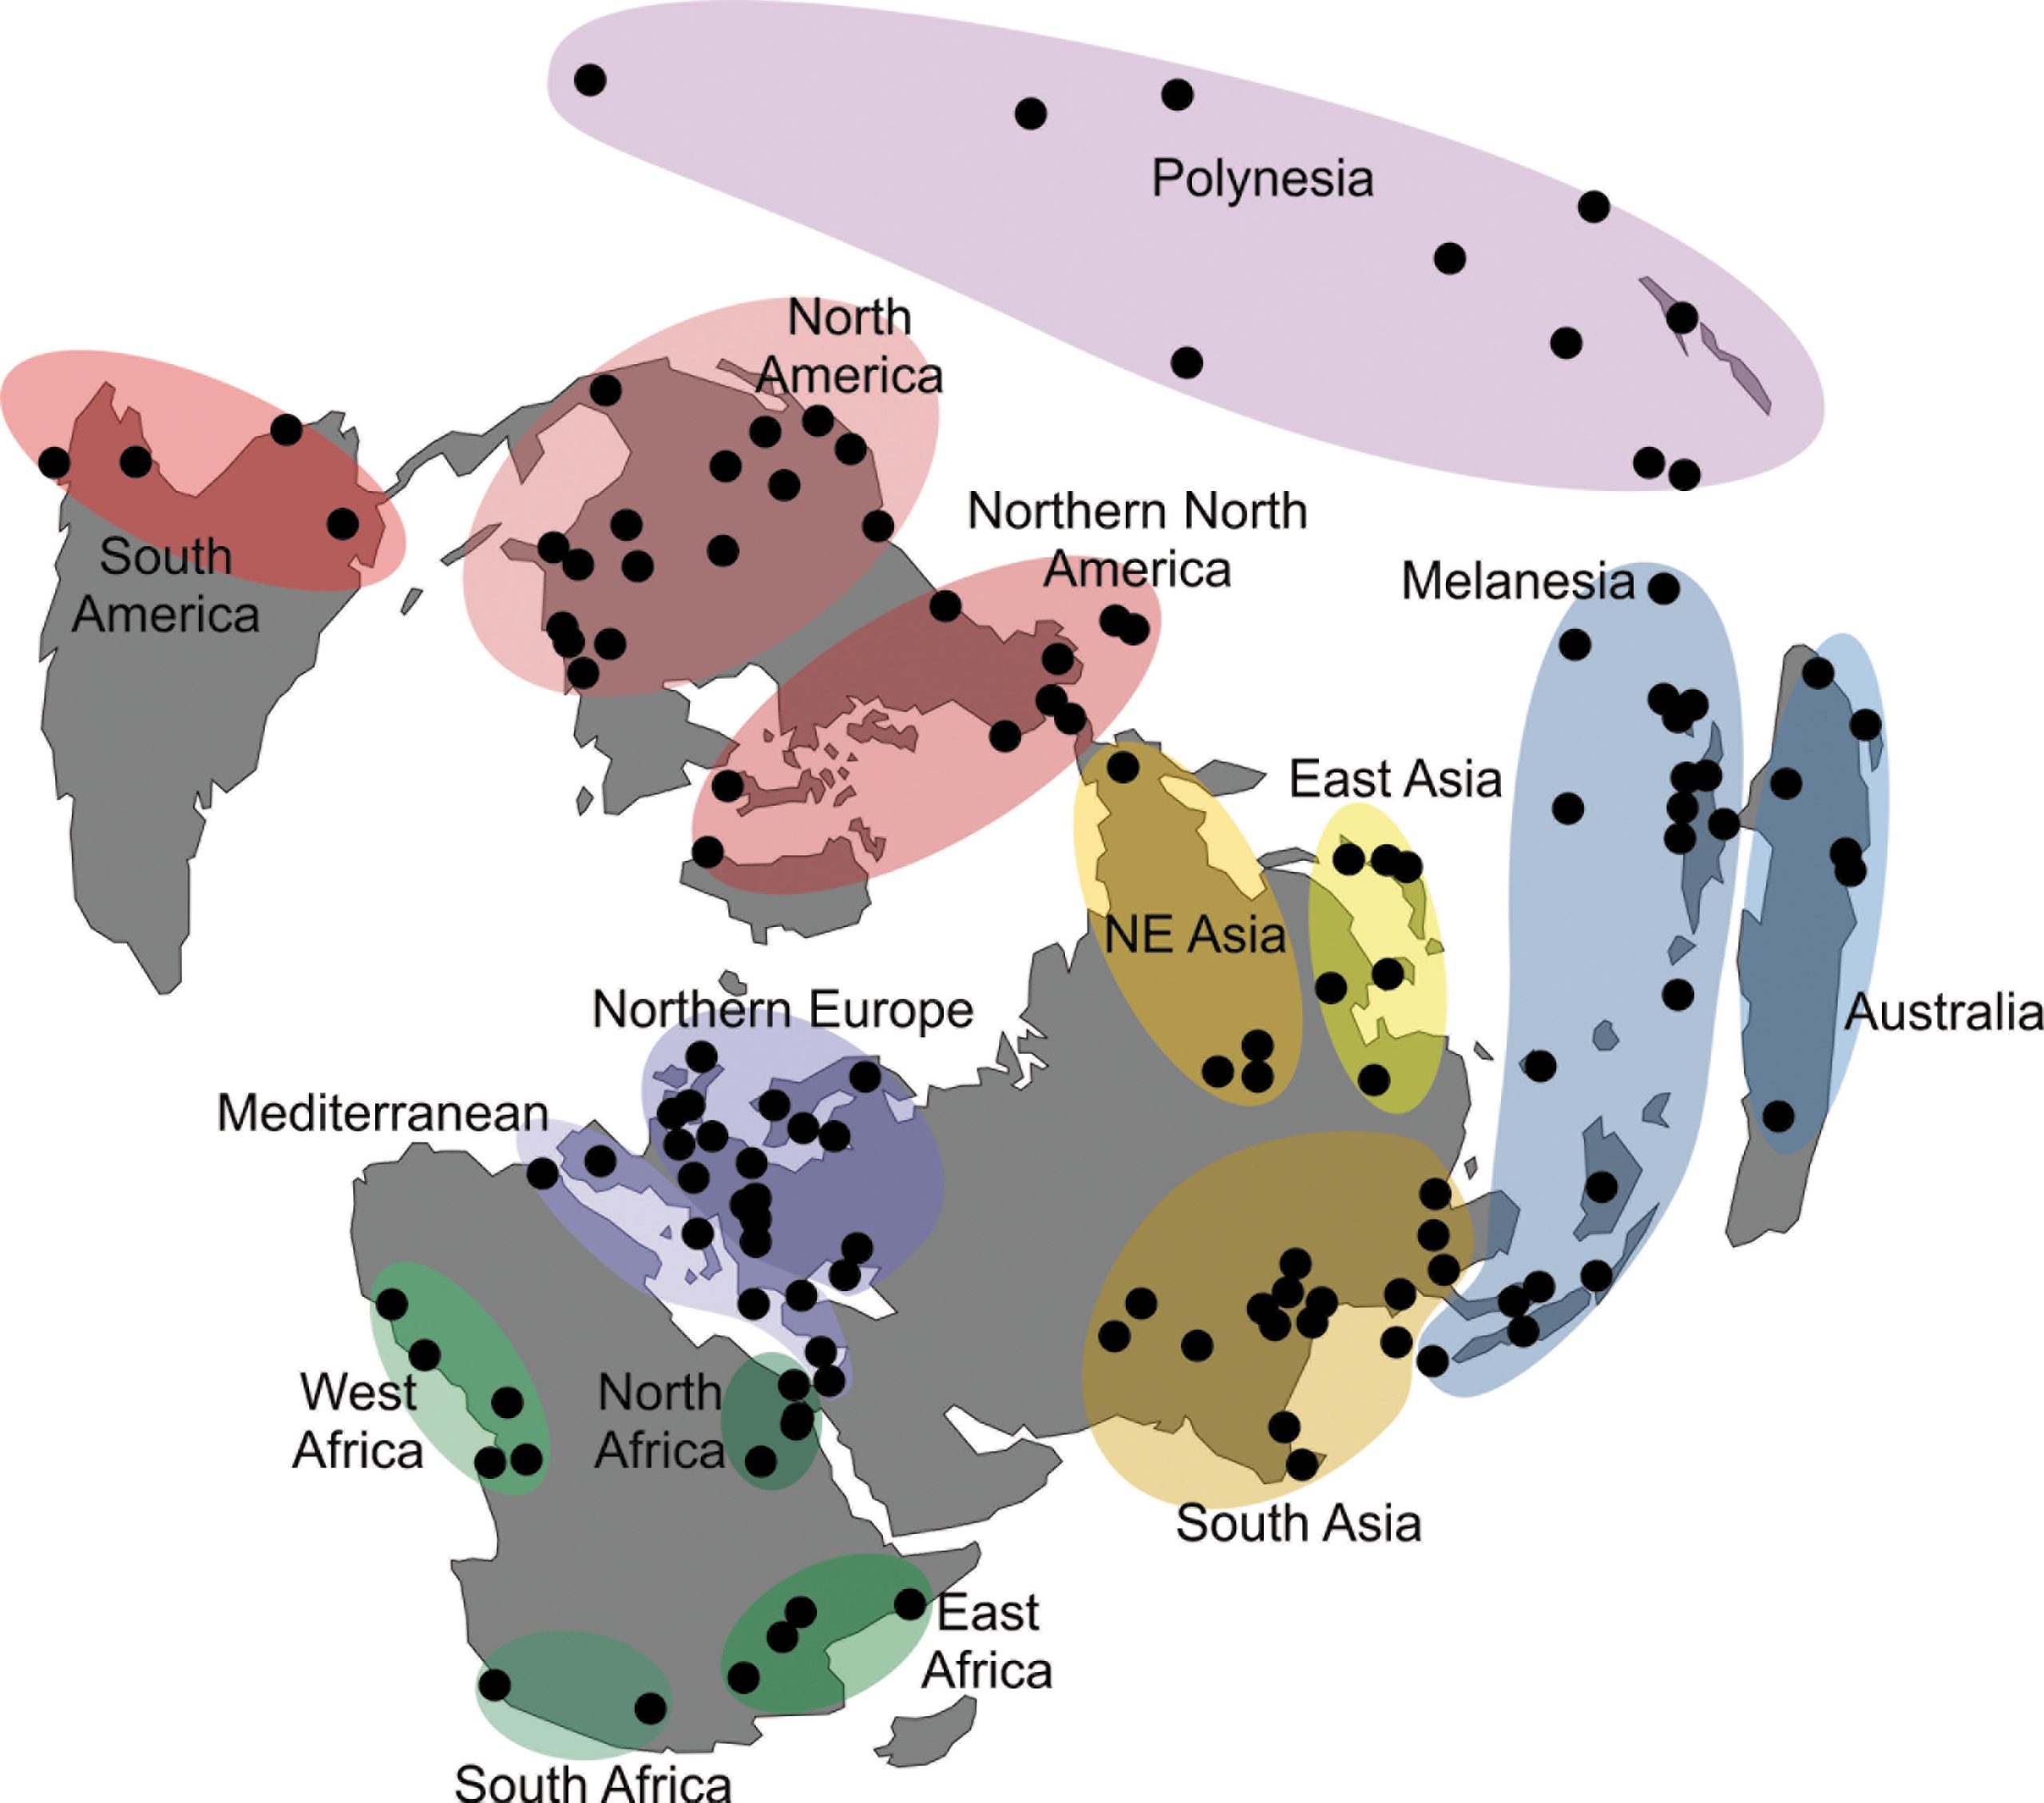
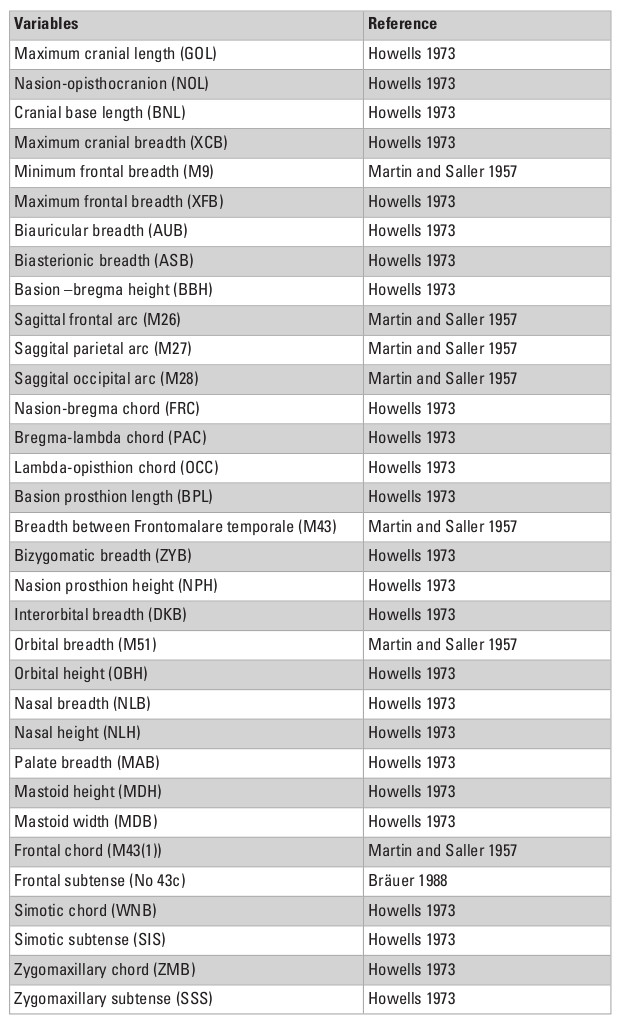
To explore the morphological variance of recent Asian populations, I used a dataset of 33 linear craniometric measurements from 7422 individuals collected by Prof. Tsuheniko Hanihara, representing 135 populations from all major regions of the planet (Table 1). Details of the dataset can be obtained in Hanihara (1996) and Hubbe et al. (2009). Table 2 presents a breakdown of the total sample by geographic regions and show how the different series were grouped together. The series represent samples of recent pre-industrial populations and are composed only of male individuals, because the sample size for females is considerably smaller and would preclude the analysis of a similar number of populations. The series were grouped by continent and also according to 14 subcontinental macro-regions plus a region representing Polynesia, that were defined based on general geographic and ecological proximity (Fig. 1; Hubbe et al. 2009). Asia was subdivided into three macro-regions—South, East and Northeast Asia—based on the series available.
The definition of the macro-regions followed the geographic distribution of the available samples as well as the general geographic proximities between them. While these groupings are not based on the biological history of the populations included in them, and therefore may represent artificial separations between them, previous studies (Hanihara 1996; Hubbe et al. 2009) have shown strong consistency among the series within the macro-regions, supporting their use in this study. Evidently, it is possible that more refined divisions could be defined with these data, but they would result in either a small sample of series per macro-region, or in macro-regions that overlapped. As such, the 15 macro-regions used here represent the best compromise found by the author to show the natural geographic sub-divisions of the series while maintaining enough series in each macro-region to estimate the partitioning of their variances.
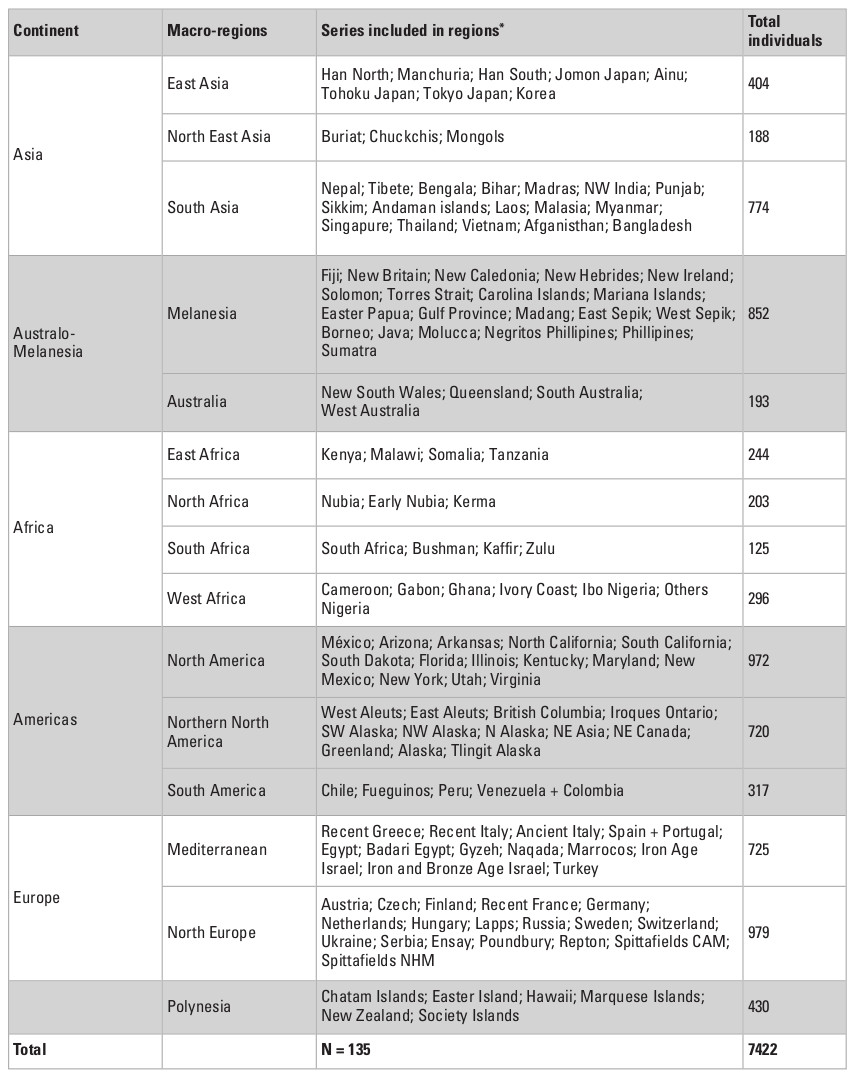
* Series’ names follow Hanihara (1996).
This study relies on the use of linear measurements, to take full advantage of the large size of the data collected by Dr. Hanihara, which represents the largest available dataset for craniometric diversity worldwide, and includes several collections that have been repatriated recently and are not available for study anymore. Although linear measurements have been largely replaced by the analysis of 3D morphometric data in the last decades, as the latter is inherently more efficient at measuring and representing shape, Hanihara’s dataset is uniquely robust to quantify the portioning of variance within and between groups on a global scale, and has been demonstrated to correlate well with other measurements of modern human diversity (Hanihara 1996). Therefore, despite the limitations of linear measurements, this particular dataset represents the best dataset available to study the structure of variance within and between modern human groups on a global scale.
Prior to the analysis of the data, the effect of size of the individuals was removed from the craniometric measurements by dividing each measurement by the geometric mean of the individuals (Darroch and Mosimann 1985; Hubbe et al. 2011). Given the focus on the structure of variance between and within-groups, I assessed the morphological variance in the dataset by using QST estimates (or minimum Fst; Relethford 1994; Relethford and Blangero 1990), which are the approximations of genetic Fst for quantitative traits. The QST estimates measure the proportion of the variance in a group of samples that is due to the differences between groups. They were calculated following Relethford and Blangero (1990), assuming an average heritability of 1.0 to present conservative estimates. Although craniometric traits have been shown to have only low to moderate heritability values (Carson 2006), the conservative heritability adopted here does not affect the arithmetic relationship between values estimated for different datasets, and will not change the hierarchy of values obtained, as long as the heritabilities can be assumed to be similar across all datasets being compared. Since all series here are representatives of recent modern humans, this is a reasonable assumption.
The QST estimates were calculated for each of the continents separately and then for each of the 15 macro-regions, to explore the proportion of variance in each combination of series that is the product of differences between groups. To extend this analysis, I also applied the Relethford-Blangero analysis (Relethford and Blangero 1990) for the continental and sub-continental groups, which compares the observed variance within each series with the expected variance based on the R-matrix calculated from these data. The R matrix consists of the standardized variances and covariances of populations around the genetic centroid of the data, and it permits the calculation of the expected phenotypic variances for each group analyzed. As a result, the Relethford-Blangero analysis calculates the residuals between the observed phenotypic variance and the variance that would be expected based on the distance of each group to the genetic centroid in the data (Rii). Assuming all groups included in the analysis are part of the same macro-population, the analysis permits to infer which groups have higher (positive residuals) or lower (negative residuals) observed variances than would be expected by its distance from the genetic centroid in the data.
The structure of the variance in Asian populations was further explored by analyzing the relationship between QST estimates and geographic distances between series. Under a null hypothesis of stochastic processes structuring the variance, like serial founder effects or isolation by distance, it is expected that QST estimates will increase proportionally to the distance between groups, and therefore will be linearly correlated with them. For this study, I calculated the QST estimate between all pairs of series within each of the macro-regions, and then averaged them to generate the mean QST between pairs of series for each macro-region. The intention with this calculation is to generate a single value that represents the amount of variance that is the result of differences between pairs of series. For each macro-region, a mean linear geographic distance between pairs of series was calculated, and the mean pairwise QST estimates within macro-regions were correlated with the mean geographic distance within macro-regions, to test if the Asian macro-regions depart from the pattern observed in other regions of the planet.
Finally, I did a similar exercise, but now between series of each Asian macro-region and series from each of the other macro-regions. QST estimates between pairs of series (each of the series in an Asian region to each of the series from another macro-region) were averaged and the values were compared to the average geographic distance between them. In this case, however, geographic distances avoid crossing large bodies of water by going through specific geographic checkpoints (see Hubbe et al. 2010 for a detailed explanation). The goal with this analysis is to test if the accumulation of variance between populations in Asia can be explained solely based on the overall distances that separate these populations from the other macro-regions of the planet. All the analyses were done in R (R Core Team 2019), with functions written specifically for it and complemented with functions from the package MASS (Venables, Ripley, and Venables 2002).
Results: Apportionment of morphological variance in Asia
The QST estimates calculated for the different combinations of the series are presented in Table 3. In general, the results are in accordance with previous worldwide studies of craniometric variance apportionment in modern humans (Relethford 1994, 2004), and show that the vast majority of the morphological variance in humans is partitioned within-groups, while less than 10% is the result of differences between-groups. However, the QST values in this study are not directly comparable to previous analysis, since the heritability assumed here is larger. In other words, as the QST estimates presented here represent the minimum QST possibly obtained (h2 = 1.0), they are smaller than previous studies that assumed lower heritabilities (usually around 0.55) and reported values between 10 and 20% (e.g., Relethford 1994, 2004).
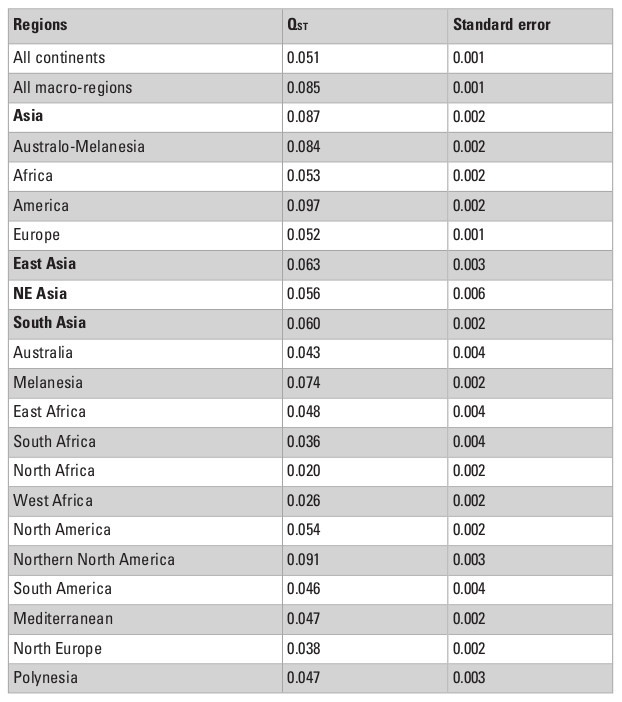
The QST estimates show that, when series are grouped by continents, the apportionment of variance between-groups is smaller (QST = 0.051) than when series are grouped by macro-regions (QST = 0.085), which suggests that continental divisions cause the morphological variance to overlap more among them (i.e., continents are not groupings that maximize the differences between groups), and as such are not necessarily natural boundaries for morphological patterns within them. The higher QST for the macro-regions, on the other hand, shows that this geographic category is more efficient at identifying groupings in the series as they are identifying higher amounts of variance between groups. In other words, these QST estimate values support the internal coherence of the macroregions defined here.
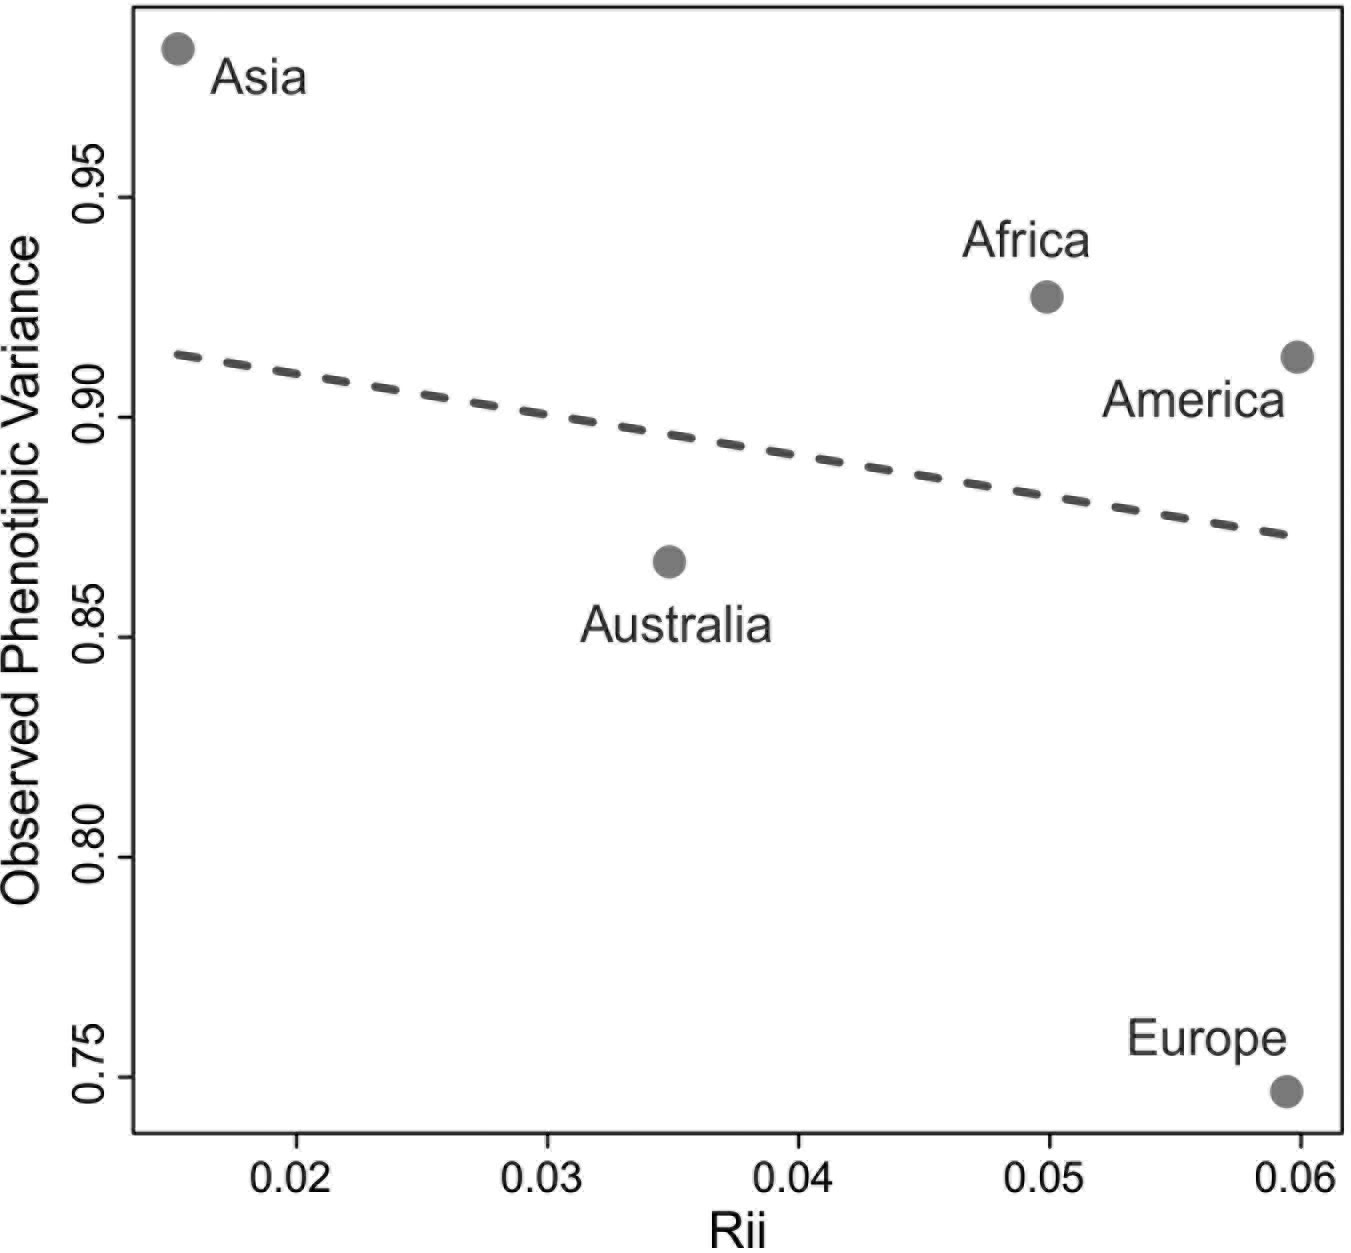
The QST values for each of the continents show considerable variation among them, with Asia and the Americas presenting almost twice as much variance between-groups (QST = 0.087 and 0.097, respectively) than the continents with the smallest QST values (Europe; QST = 0.053; and Africa; QST = 0.052). This indicates a larger degree of differentiation among series in Asia and the Americas than on Europe and Africa, supporting a larger between-groups differentiation in the former two continents. However, from these analyses alone it is impossible to ascertain if these differences are being driven by the geographic and ecological characteristics of these continents, or if they follow broader global patterns of isolation by distance, since the average distance between series in Asia and America (4252.0 km and 4775.0 km, respectively) are also larger than the average distances between series in Europe (2027.8 km) and Africa (3129.9 km). The results of the Relethford-Blangero analysis for the continental division (Fig. 2; Table 4) supports high levels of morphological variance within Asia, as the observed phenotypic variance in this continent is well above the expected one (defined by the regression line in the plot). The other continents show observed phenotypic variances very close to the expected ones, supporting the unique variance levels of Asian populations on a comparative continental level.
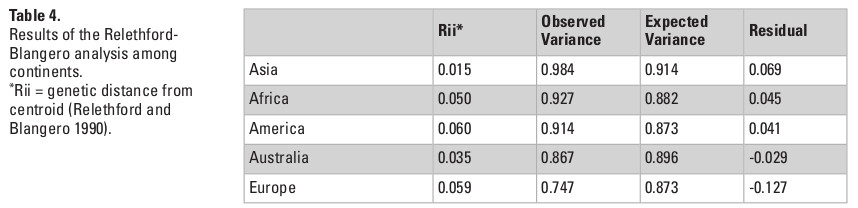
*Rii = genetic distance from centroid (Relethford and Blangero 1990).
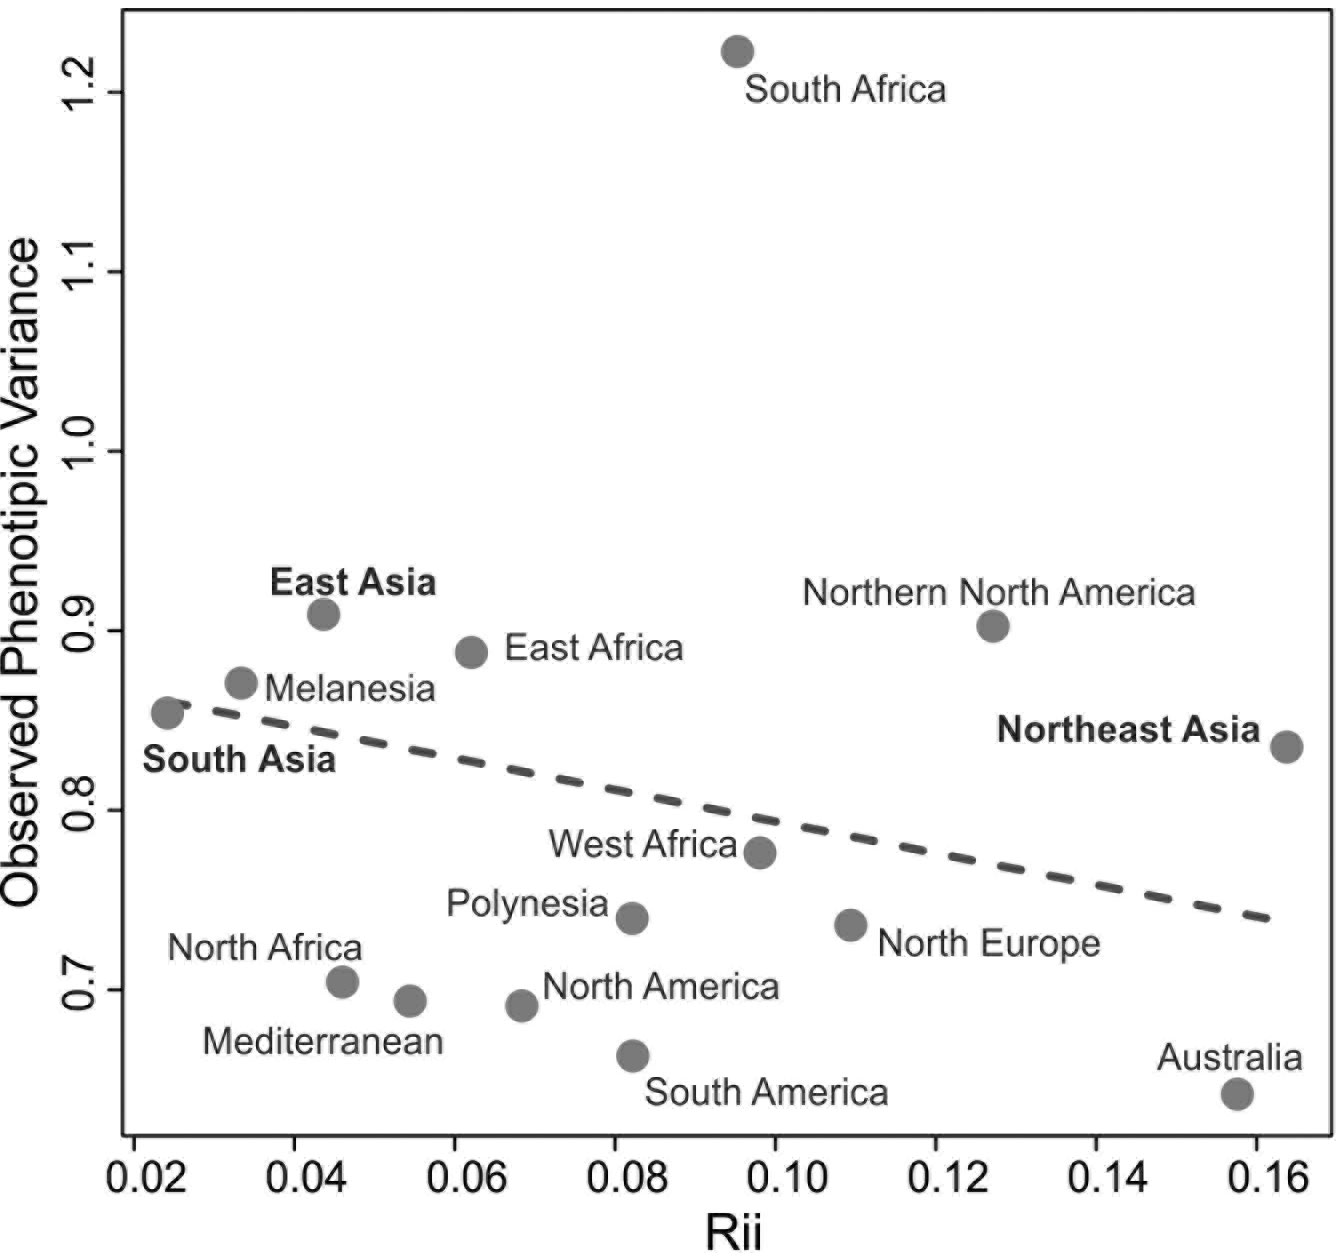
When the series are grouped by the macro-regions, the overall QST values in Asia decline considerably (Table 3). This change in pattern indicates that the high observed QST values observed in Asia as a whole is a product of differences between the three macro-regions of the continent, and that differences within regions are not of the same magnitude. This interpretation is confirmed by the Relethford-Blangero Analysis (Fig. 3; Table 5), which shows that one of the Asian regions (South Asia) have observed phenotypic variance smaller than the expected ones. Northeast Asia and East Asia still show a higher than expected phenotypic variance, and therefore presents a different pattern of variance structure than the other Asian region. None of the Asian macro-regions, however, show levels of variance as high as South Africa, which appears as a clear outlier in the analysis. While outside of the scope of this chapter, it is noteworthy to point out that this pattern in South Africa is consistent with the evidence of high biological diversity in the African continent in general (Betti et al. 2009; Manica et al. 2007).
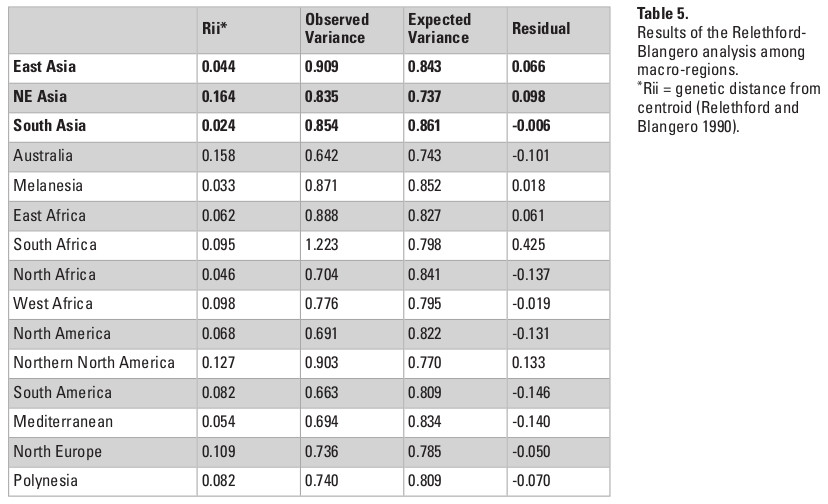
* Rii = genetic distance from centroid (Relethford and Blangero 1990).
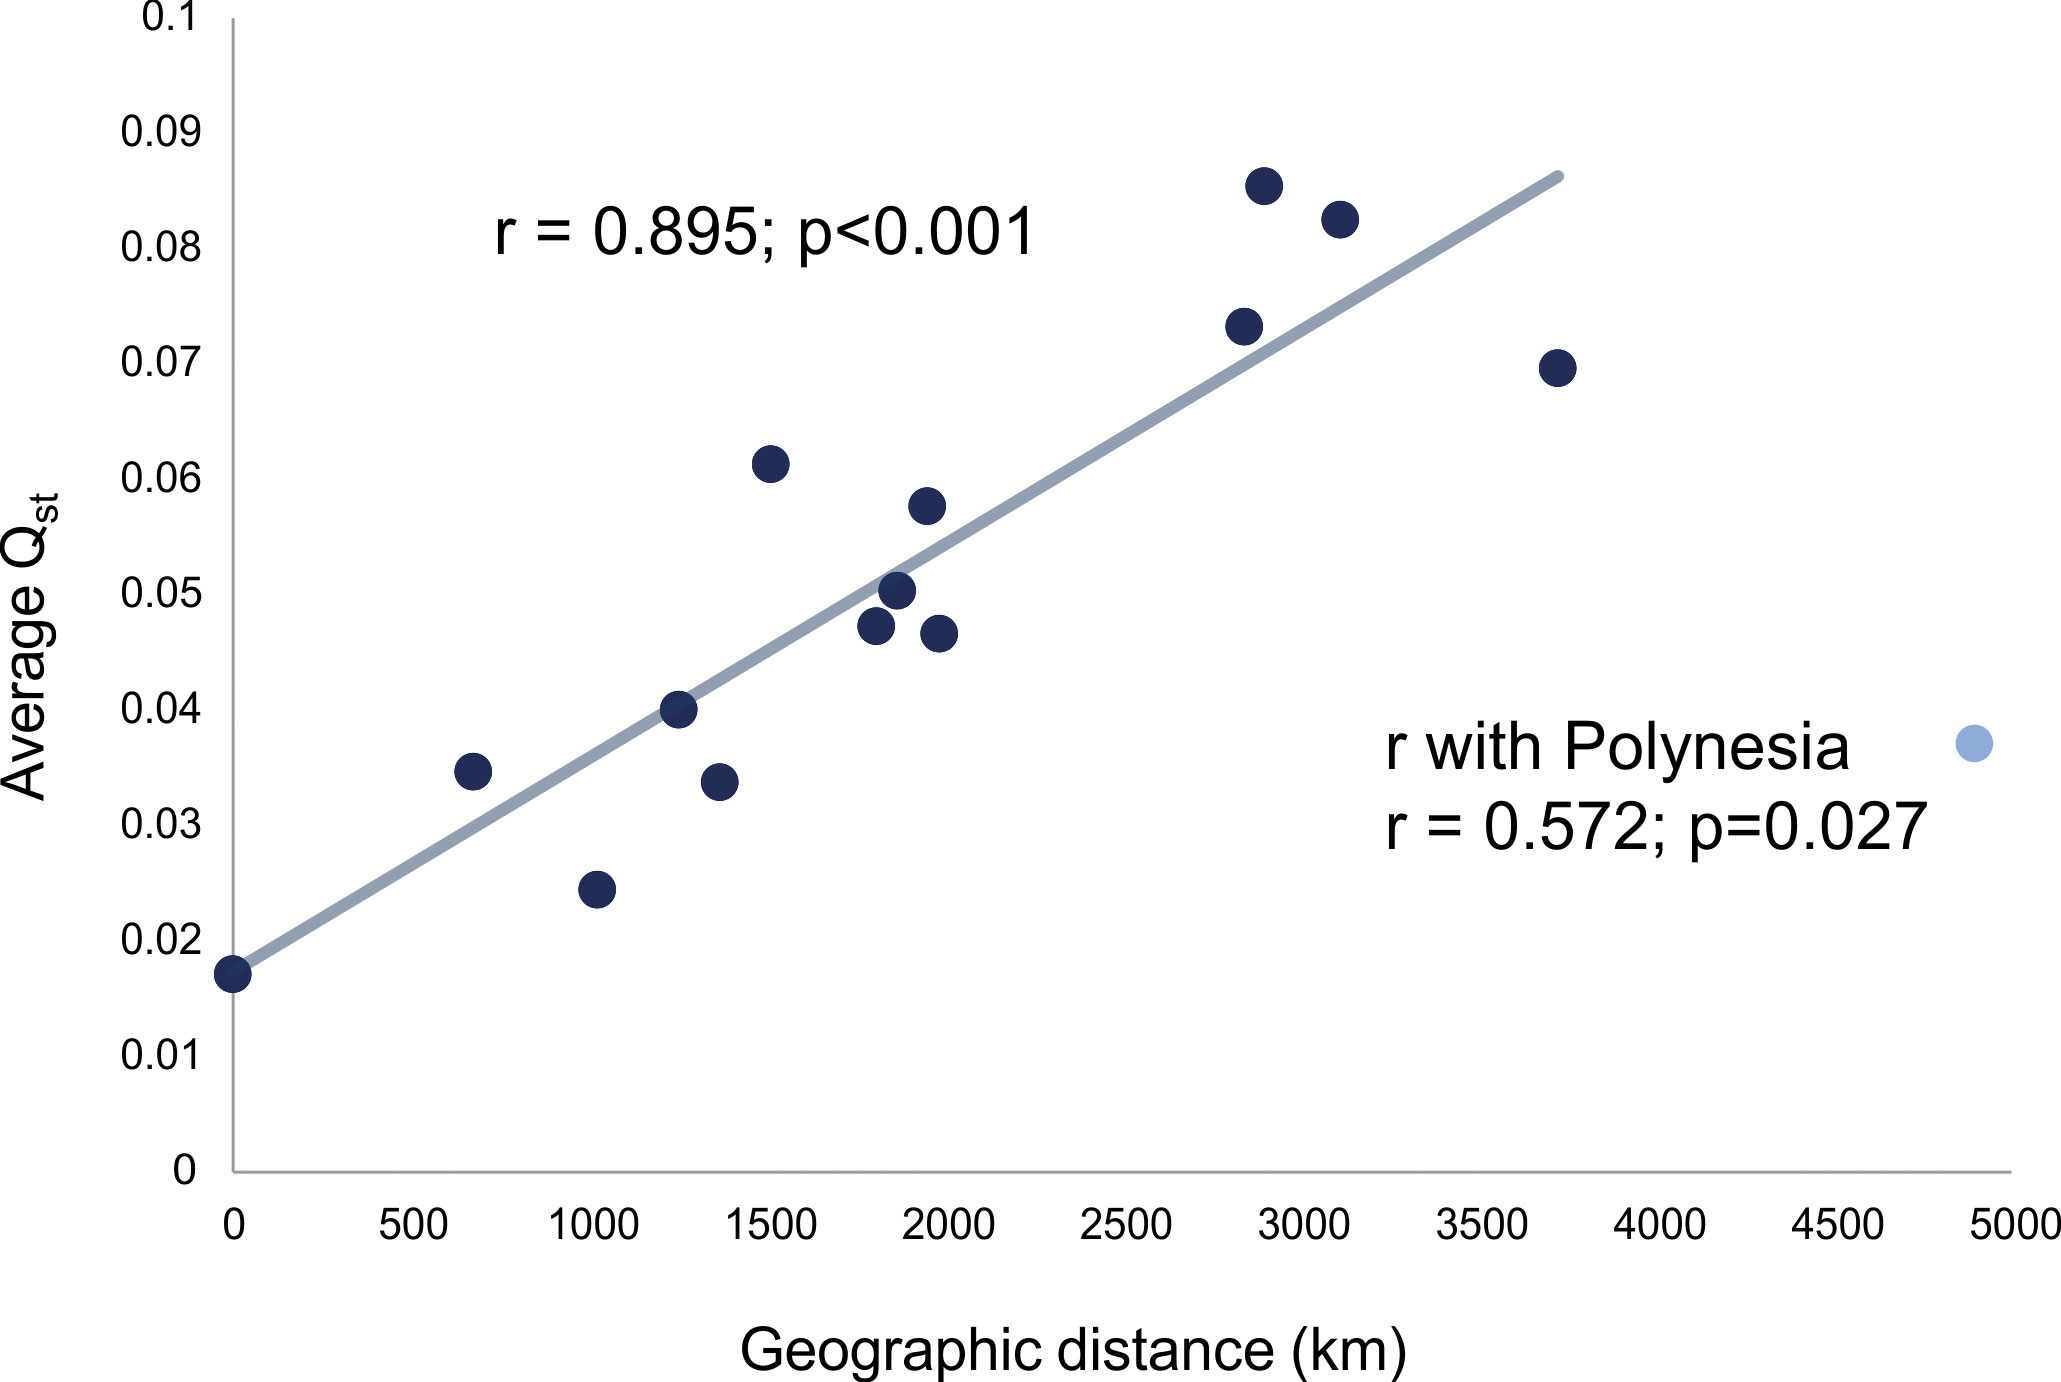
The last group of analyses carried out for this study relates to the comparison of the average QST to geographic distances among the samples with the purpose of exploring the role that isolation by distance played in structuring the morphological variance within and between macro-regions. Figure 4 shows the association between the average QST within macro-regions and the average distance in kilometers within macro-regions. With the exception of Polynesia, all macro-regions show a very strong linear relationship between QST and geographic distance (r=0.895, p<0.001; with Polynesia, r=0.572, p=0,027), which indicates a very strong geographic logic to the differentiation of groups within these macro-regions. These results support the idea that, across the planet, regional differences in cranial morphology are regulated by diminishing gene flow between groups as distance between populations increase. The lower relationship of QST/km observed in Polynesia is an interesting exception, as it actually lends support to differences being mediated by reduced gene flow. Although distances between series in Polynesia are on average larger than on any of the continents, traveling time between them in the past was not, as Polynesian efficient seafaring facilitated the crossing of larger distances. As such, the effective gene flow between populations was larger than what would be expected if groups were moving across land, since traveling between islands is facilitated by technological innovations. In other words, the Polynesia QST/km ratio falls well within the expectation of gene flow regulating the structure of variance between these populations.
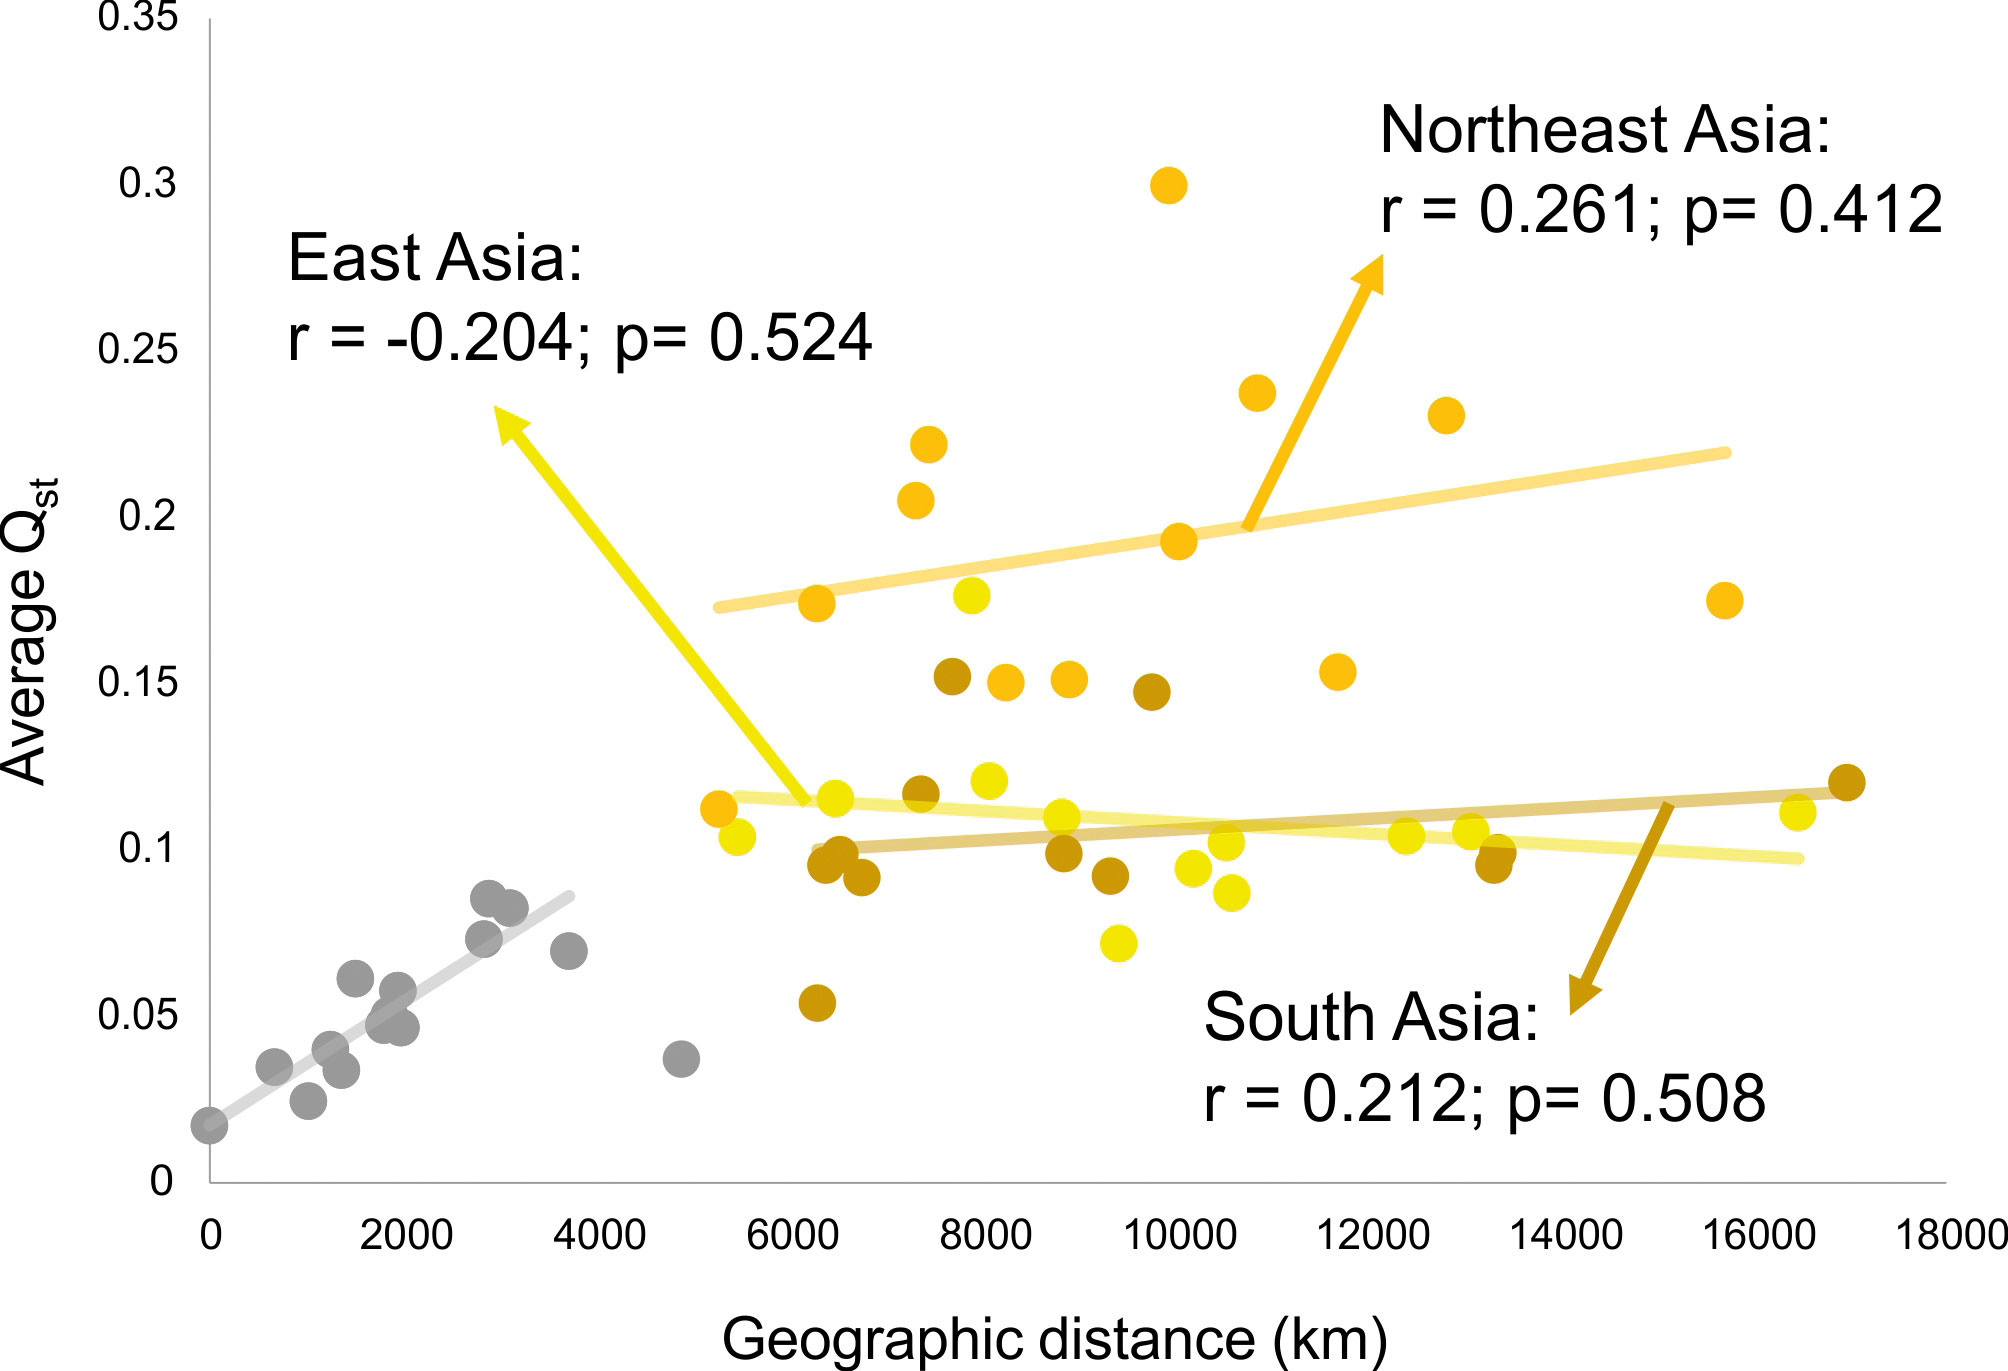
This scenario of isolation by distance structure of variance is not sustained, however, when comparisons are done between macro-regions. Figure 5 shows the relationship of average QST to average distance in kilometers between each of the Asian macro-regions and the other regions of the planet. As is evident in this plot, a linear isolation by distance is not enough to explain the differences between continents, as none of the Asian macro-regions show a significant correlation between QST and geographic distance, when compared to macro-regions outside of Asia. Therefore, isolation by distance is not structuring the morphological variance among macro-regions in Asia. This is somewhat expected, as gene flow will effectively drop to values near zero after enough distance has been accumulated between populations, even if they are connected by other populations in between, so that after that threshold is reached geographic distance will not contribute to the partitioning of variance. For the series included here, this threshold seems to be about five thousand kilometers (Fig. 5), which is the point that separates distances within macro-regions (highly correlated with geography) and distances between macro-region (uncorrelated with geography). On the other hand, if morphological variance continued to be added linearly into the separating populations, like for example through the accumulation of neutral mutations over generations or serial founder-effects, there would still be an increase with distance, even after gene flow stops between populations. The fact that this is not the case (at least in Asia), suggests that morphological variance is being maintained stable over larger geographic spaces, possibly as a result of stabilizing selection.
What is quite remarkable from this analysis is that the average QST among Asian macro-regions and the rest of the planet is not the same (ANOVA F = 22.45; p<0.001). While South and East Asian series show similar average QST values (Tukey HSD p=0.971) with other macro-regions, Northeast Asia shows higher average values (Tukey HSD p<0.001 for both pairwise comparisons). This suggests that not all Asian macro-regions follow the same pattern of partitioning of variance and that factors unique to Northeast Asian populations differentiate this series from the other two Asian regions, by increasing its morphological distances (i.e., the proportion of variance due the difference between groups) to other regions in the planet. Therefore, while within each of the macro-regions a similar geographic structure is observed across the entire planet (Fig. 4), the variance between macro-regions is being structured by different kind of processes (Fig. 5). These results suggest that the evolutionary forces shaping the morphological variance in the planet change according to the scale of the analysis.
Discussion: The structure of morphological variance in Asia
The analysis of the apportionment of cranial morphological variance across Asia shows the complexities in trying to understand the evolutionary forces that are structuring phenotypic variance over time and space in modern humans. Although previous studies have supported that the morphological differentiation on a global scale tends to follow patterns similar to what would be expected in phenotypic traits evolving neutrally (Betti et al. 2009; Manica et al. 2007; Relethford 1994, 2004; Roseman 2004; von Cramon-Taubadel and Weaver 2009), a more nuanced analysis, as the one presented here, shows that this may be a simplistic view of the processes structuring our species’ morphological variance. Acknowledging this complexity is particularly relevant in the context of studies of human dispersion, since they depend on the reconstruction of the ancestral condition of the populations being sampled, and inaccurate assumptions about the forces that promoted the differentiation of the populations over space and time can lead to vastly incorrect reconstructions of the dispersion paths under study.
In the context of this discussion, the results presented here provide a cautionary tale for the general assumptions that are usually informing studies about past modern human migration and dispersion routes. As shown with the analyses presented here, the hypothesis that the forces that structure the morphological variance among modern humans worldwide are relatively constant cannot be easily supported. Indeed, what we observe is that the scale of analysis is extremely relevant in the way by which morphological variance is structured worldwide. While there is a clear pattern of differentiation that follows a geographic structure on a global scale (Betti et al. 2009; Howells 1989; Manica et al. 2007; Relethford 1994), the rate of this differentiation or the degree to which geography correlates with morphological differentiation does not appear to be constant or linear. The results presented here show that the morphological differentiation of the skull does not correlate linearly with geography when Asian macro-regions are compared to other macro-regions of the planet, even though within macro-regions, morphological distances show a strong geographic structure. Therefore, it is possible that the morphological differentiation between larger macro-regions in the planet follows a pattern closer to punctuated equilibrium, with morphological variance being restrained for longer periods of time, before selective pressures are released and a quick influx of morphological variance is observed. Such a pattern of evolution through stasis and quick bursts would still create a global structure of variance that is similar to that resulting from sequential founder-effects and isolation by distance. Moreover, such a model of morphological differentiation fits better with the current evidence of early African morphological patterns being retained among Late Pleistocene populations in Asia (Harvati 2009; Hubbe et al. 2011), Australo-Melanesia (Schillaci 2008) and the Americas (Hubbe et al. 2011). Even though the analyses presented here are not enough to elucidate the mechanism that is structuring the morphological variance within and between macro-regions in Asia and in the planet, they do open the possibility to consider that there are other ways by which morphological variance is being structured in the continent. In other words, they challenge the assumption that uniform processes of differentiation explain the diversification of modern human cranial morphology across the planet or across different spatial scales of analysis.
As such, the analyses presented here suggest that the forces structuring the morphological variance in Asia may follow or depart from global patterns, depending on the scale of analysis. When the morphological variance within macro-regions is analyzed, a strong geographic signal of gene flow mediation is observed in all macro-regions of the planet, including the three macro-regions of Asia. However, there are different responses between macro-regions, as the morphological distances between Asian regions and other macro-regions of the planet show no clear pattern of geographic structure. In other words, the evolutionary forces that might have produced the observed structure in the phenotypic variance between and within modern humans cannot be easily explained by the linear associations of the series over long distances. Moreover, the level of differentiation between regions varies significantly within the Asian macro-regions, with South and East Asian showing similar levels of differentiation to the series from other macro-regions, while Northeast Asia shows significantly higher levels of differentiation. This shows that, on a macro-regional level, there can be significantly different patterns of apportionment of variance, which must be taken into account before creating accurate models of human dispersion in the past.
The analyses of morphological variance apportionment in Asia allows to explore the expectations that were derived from the four major dispersion events identified in Asia. For instance, the results presented here show no evidence of the first stage of dispersion out of Africa in the morphological variance of the series. If the morphology that characterize early populations in the continent and in some isolated groups in SE Asia (Reyes-Centeno et al. 2015) had been a significant source of influx of variance on later populations, or if admixture with other hominin populations was significant in this first stage, it would be expected that the variance apportionment would be inflated within regions and that there would be differences in apportionment between East and South Asia. As the two regions show similar patterns of variance structure among them, the contribution of this early dispersion was probably not significant. This is not to say, however, that the early dispersion or admixture with early hominins did not contribute to the modern morphology through admixture. It means only that it did not contribute to the structuring of variance (i.e., the admixture that happened was distributed across larger portions of the continent over time and did not result in increased difference between populations more closely related to the first dispersion). The distinction is important to be made, as the analyses presented here focus only the apportionment of variance and not on the absolute difference in morphological shape between populations. Evidently, this conclusion is limited to the populations that were included in this study, and the inclusion of more populations that retained the contribution of early morphological dispersion event and admixture in Asia could change this conclusion.
The second large stage of dispersion seems to be strongly associated with the morphological structure in Asia, given the strong geographic structure that exists within the macro-regions. As suggested before, the result for the analyses between regions support a pattern of punctuated equilibrium for the structure of variance in Asia, which can be achieved either through a fast rate of expansion across Asia, followed by isolation by distance models of differentiation after regions have been initially occupied, or by evolutionary constrains (i.e., stabilizing selection) to the accumulation of morphological variance. Any of these processes, as well as the different combinations of them, would result in morphological variances not structured on larger continental scales, while keeping a strong geographic structure within regions.
While it is evident that the expansion across Asia has a strong impact on the morphological variance in the whole continent, other factors play an important role as well. Such is the case for the adaptations seen in populations who colonized colder climates, as described in the third large stage of dispersion in Asia. As shown by a series of previous studies, adaptation to cold environments, mostly as a response to optimizing heat loss in the head (Harvati and Weaver 2006; Hubbe et al. 2009) has promoted significant changes in the morphological pattern of Asian and European populations living in high latitudes (Evteev et al. 2014; Hubbe et al. 2009; Evteev, this volume). These changes probably were complemented by adaptations that resulted from changes in diet and cultural buffering that permitted the occupation of the higher latitude in the continent. While previous studies have not explored this possibility in Asia per se, cultural changes in diet and behavior can have important impact in the overall cranial shape of populations (Galland et al. 2016; González-José et al. 2005).This adaptative response to cold climates shows an important impact in the structure of morphological variance of Northeast Asian populations. Northeast Asia shows a high within-group variance (Fig. 3), which is different from the other two Asian macro-regions. However, this variance is still structured geographically among the series within the macro-region, following the pattern seen worldwide. Finally, it differs again from the others in the average distance between this region and other regions of the planet, which suggests that the adaptation to colder environments is responsible for an important portion of the variance structure in the region. Interestingly, the differences promoted by cold adaptation do not erase the other forces structuring morphological variance, acting as an additive component to the variance between groups.
Lastly, the fourth stage of human dispersion across Asia, which is associated with the increased mobility of human groups during the last two thousand years, seems to have had a smaller impact on the overall structure of the morphological variance in the continent. The geographic structure within Asian regions is comparable to other regions of the planet, which is not what would be expected if gene flow had increased significantly between populations separated by longer distances in the continent. While this is not a new find and several morphologic and genetic studies have described the strong spatial structure within the continent (HUGO Pan-Asian SNP Consortium et al. 2009; Reyes-Centeno et al. 2014; Reyes-Centeno et al. 2015), it is still worth discussing why the intense human mobility in Asia (and in the planet as a whole) that characterizes the second half of the Holocene, did not have a more visible impact on the structure of the morphological variance. The present study lacks the data to explore this point in more detail, but it should be a topic of further research, given the potential impact that the more recent events had in reshaping the cultural background of Asian populations.
In conclusion, this chapter highlights the importance of understanding morphological variance from the point of view of the different evolutionary forces shaping the structure of the phenotypic variance between and within populations, as this is a central aspect for estimating ancestral morphological characteristics of human populations, and is fundamental to trace back the most likely dispersion events and migration routes that connect those populations over space and time. As I tried to demonstrate with the analysis of morphological variance across three different macro-regions in Asia, an assumption that populations over large regions were differentiated through similar evolutionary forces acting over different scales of space and time is not an accurate approach for reconstructing past dispersion events. On the contrary, it will result in an inaccurate estimate of population movements in the past. As such, a better understanding of the evolutionary forces structuring the morphological variance, derived from studies conducted by combining different datasets (morphological, genetic, linguistic, archaeological), is an important step in refining our ability to better comprehend the ways by which human groups colonized and expanded across the planet.
Acknowledgements
I want to thank Hugo Reyes-Centeno, Katerina Harvati, and Gerhard Jäger for the invitation to participate on the symposium that inspired this volume. I am eternally grateful to Prof. Tsuheniko Hanihara for making his dataset available for this study.
References
Balaresque, P., N. Poulet, S. Cussat-Blanc, P. Gerard, L. Quintana-Murci, E. Heyer, and M. A. Jobling. 2015. Y-chromosome descent clusters and male differential reproductive success: Young lineage expansions dominate Asian pastoral nomadic populations. European Journal Of Human Genetics 23: 1413.
Betti, L., F. Balloux, W. Amos, T. Hanihara, and A. Manica. 2009. Distance from Africa, not climate, explains within-population phenotypic diversity in humans. Proceedings of the Royal Society B: Biological Sciences 276 (1658): 809–814.
Carlson, D. S., and D. P. Van Gerven. 1979. Diffusion, biological determinism, and biocultural adaptation in the Nubian Corridor. American Anthropologist 81 (3): 561–580.
Carson, E. A. 2006. Maximum likelihood estimation of human craniometric heritabilities. American Journal of Physical Anthropology 131 (2): 169–180.
Darroch, J. N., and J. E. Mosimann. 1985. Canonical and Principal Components of Shape. Biometrika 72 (2): 241–252.
de Azevedo, S., A. Nocera, C. Paschetta, L. Castillo, M. Gonzalez, and R. Gonzalez-Jose. 2011. Evaluating microevolutionary models for the early settlement of the New World: the importance of recurrent gene flow with Asia. American Journal of Physical Anthropology 146 (4): 539–552.
Evteev, A., A. L. Cardini, I. Morozova, and P. O’Higgins. 2014. Extreme climate, rather than population history, explains mid-facial morphology of northern asians. American Journal of Physical Anthropology 153 (3): 449–462.
Galland, M., D. P. Van Gerven, N. von Cramon-Taubadel, and R. Pinhasi. 2016. 11,000 years of craniofacial and mandibular variation in Lower Nubia. Scientific Reports 6: 31040.
González-José, R., F. Ramirez-Rozzi, M. Sardi, N. Martinez-Abadias, M. Hernandez, and H. M. Pucciarelli. 2005. Functional-cranial approach to the influence of economic strategy on skull morphology. American Journal of Physical Anthropology 128 (4): 757–771.
Hallgrímsson, B., D. E. Lieberman, W. Liu, A. F. Ford-Hutchinson, and F. R. Jirik. 2007. Epigenetic interactions and the structure of phenotypic variation in the cranium. Evolution & Development 9 (1): 76–91.
Hanihara, T. 1996. Comparison of craniofacial features of major human groups. American Journal of Physical Anthropology 99(3): 389–412.
Hansen, V. 2012. The Silk Road: A new history. Oxford, New York: Oxford University Press.
Harvati, K. 2009. Into Eurasia: A geometric morphometric re-assessment of the Upper Cave (Zhoukoudian) specimens. Journal of Human Evolution 57 (6): 751–762.
Harvati, K., and T. D. Weaver. 2006. Human cranial anatomy and the differential preservation of population history and climate signatures. The Anatomical Record Part A: Discoveries in Molecular, Cellular, and Evolutionary Biology 288A (12): 1225–1233.
Howells, W. W. 1989. Skull shapes and the map: Craniometric analyses in the dispersion of modern Homo. Cambridge: Peabody Museum of Archaeology and Ethnology Distributed by Harvard University.
Hubbe, M., T. Hanihara, and K. Harvati. 2009. Climate signatures in the morphological differentiation of worldwide modern human populations. Anatomical Record-Advances in Integrative Anatomy and Evolutionary Biology 292 (11): 1720–1733.
Hubbe, M., K. Harvati, and W. Neves. 2011. Paleoamerican morphology in the context of European and East Asian Late Pleistocene variation: Implications for human dispersion into the New World. American Journal of Physical Anthropology 144 (3): 442–453.
Hubbe, M., W. A. Neves, and K. Harvati. 2010. Testing evolutionary and dispersion scenarios for the settlement of the New World. Plos One 5(6): e11105.
HUGO Pan-Asian SNP Consortium, M. A. Abdulla, I. Ahmed, A. Assawamakin, J. Bhak, S. Brahmachari, et al. 2009. Mapping human genetic diversity in Asia. Science 326 (5959): 1541–1545.
Jacobs, Z., B. Li, M. V. Shunkov, M. B. Kozlikin, N. S. Bolikhovskaya, et al. 2019. Timing of archaic hominin occupation of Denisova Cave in southern Siberia. Nature 565 (7741): 594–599.
Klingenberg, C. P. 2014. Studying morphological integration and modularity at multiple levels: Concepts and analysis. Philosophical transactions of the Royal Society of London. Series B, Biological sciences 369 (1649): 20130249-20130249.
Lahr, M. M. n. 1996. The evolution of modern human diversity: A study of cranial variation. New York: Cambridge University Press.
Lieberman, D. 2011. The evolution of the human head. Cambridge: Belknap Press of Harvard University Press.
Manica, A., W. Amos, F. Balloux, and T. Hanihara. 2007. The effect of ancient population bottlenecks on human phenotypic variation. Nature 448: 346.
Mellars, P. 2006. Going east: New genetic and archaeological perspectives on the modern human colonization of Eurasia. Science 313 (5788): 796.
Mellars, P., K. C. Gori, M. Carr, P. A. Soares, and M. B. Richards. 2013. Genetic and archaeological perspectives on the initial modern human colonization of southern Asia. Proceedings of the National Academy of Sciences 110 (26): 10699–10704.
Neves, W. A., and M. Hubbe. 2005. Cranial morphology of early Americans from Lagoa Santa, Brazil: Implications for the settlement of the New World. Proceedings of the National Academy of Sciences 102 (51): 18309–18314.
Petraglia, M. D., M. Haslam, D. Q. Fuller, N. Boivin, and C. Clarkson. 2010. Out of Africa: New hypotheses and evidence for the dispersal of Homo sapiens along the Indian Ocean rim. Annals of Human Biology 37 (3): 288–311.
Pinhasi, R. O. N., and N. von Cramon-Taubadel. 2012. A craniometric perspective on the transition to agriculture in Europe. Human Biology 84 (1): 45–66.
R Core Team. 2019. R: A language and environment for statistical computing. Retrieved from https://www.R-project.org/
Rasmussen, M., X. Guo, Y. Wang, K. E. Lohmueller, S. Rasmussen, et al. 2011. An Aboriginal Australian genome reveals separate human dispersals into Asia. Science 334 (6052): 94–98.
Reich, D., N. Patterson, M. Kircher, F. Delfin, M. R. Nandineni, et al. 2011. Denisova admixture and the first modern human dispersals into Southeast Asia and Oceania. American Journal of Human Genetics 89 (4): 516–528.
Relethford, J. H. 1994. Craniometric variation among modern human populations. American Journal of Physical Anthropology 95 (1): 53–62.
Relethford, J. H. 2004. Global patterns of isolation by distance based on genetic and morphological data. Human Biology 76 (4): 499-513.
Relethford, J. H., and J. Blangero. 1990. Detection of differential gene flow from patterns of quantitative variation. Human Biology 62 (1): 5–25.
Reyes-Centeno, H., S. Ghirotto, F. Détroit, D. Grimaud-Hervé, G. Barbujani, and K. Harvati. 2014. Genomic and cranial phenotype data support multiple modern human dispersals from Africa and a southern route into Asia. Proceedings of the National Academy of Sciences 111 (20): 7248.
Reyes-Centeno, H., M. Hubbe, T. Hanihara, C. Stringer, and K. Harvati. 2015. Testing modern human out-of-Africa dispersal models and implications for modern human origins. Journal of Human Evolution 87: 95–106.
Roseman, C. C. 2004. Detecting interregionally diversifying natural selection on modern human cranial form by using matched molecular and morphometric data. Proceedings of the National Academy of Sciences of the United States of America 101 (35): 12824–12829.
Schillaci, M. A. 2008. Human cranial diversity and evidence for an ancient lineage of modern humans. Journal of Human Evolution 54 (6): 814–826.
Smith, H. F. 2009. Which cranial regions reflect molecular distances reliably in humans? Evidence from three-dimensional morphology. American Journal of Human Biology 21 (1): 36–47.
Strauss, A., M. Hubbe, W. A. Neves, D. V. Bernardo, and J. P. Atui. 2015. The cranial morphology of the Botocudo Indians, Brazil. American Journal of Physical Anthropology 157 (2): 202–216.
Teixeira, J. C., and A. Cooper. 2019. Using hominin introgression to trace modern human dispersals. Proceedings of the National Academy of Sciences 116 (31): 15327.
Valentin, F., F. Détroit, M. J. T. Spriggs, and S. Bedford. 2016. Early Lapita skeletons from Vanuatu show Polynesian craniofacial shape: Implications for remote oceanic settlement and Lapita origins. Proceedings of the National Academy of Sciences 113 (2): 292.
Venables, W. N., B. D. Ripley, and W. N. Venables. 2002. Modern applied statistics with S. 4th edition. New York: Springer.
von Cramon-Taubadel, N. 2009. Congruence of individual cranial bone morphology and neutral molecular affinity patterns in modern humans. American Journal of Physical Anthropology 140 (2): 205–215.
von Cramon-Taubadel, N. 2011. Global human mandibular variation reflects differences in agricultural and hunter-gatherer subsistence strategies. Proceedings of the National Academy of Sciences 108 (49): 19546–19551.
von Cramon-Taubadel, N. 2014. Evolutionary insights into global patterns of human cranial diversity: Population history, climatic and dietary effects. Journal of Anthropological Sciences 92: 43–77.
von Cramon-Taubadel, N., A. Strauss, and M. Hubbe. 2017. Evolutionary population history of early Paleoamerican cranial morphology. Science advances 3: e1602289.
von Cramon-Taubadel, N., and T. D. Weaver. 2009. Insights from a quantitative genetic approach to human morphological evolution. Evolutionary Anthropology 18 (6): 237–240.
Zerjal, T., Y. Xue, G. Bertorelle, R. S. Wells, W. Bao, et al. 2003. The genetic legacy of the Mongols. American Journal of Human Genetics 72 (3): 717–721.