Abstract
The left upper third molar from the Megalopolis Basin is enigmatic due to its problematic preservation and context. The Megalopolis molar is the only possible human fossil known to date from the Megalopolis Basin. It was found on the surface during geological surveys in 1962-63. Based on the faunal assemblage collected during the same survey, it was proposed to be of Middle Pleistocene age and possibly one of the oldest human fossils in Europe. However, its actual geological age is unknown. In the past, dental crown outline analysis has been successfully used to differentiate between hominin species and populations. We applied the method to upper third molars, attempting to shed light on the affinities of the Megalopolis specimen. Principal component analysis (PCA) of the crown outline shape grouped the Megalopolis molar with our Homo sapiens sample; however, the PCA in form space, including shape plus size, as well as Procrustes distances based on overall shape, grouped it with our Neanderthal comparative sample. We conclude that its most likely identification is as a member of the Neanderthal lineage. However, we urge further analyses with an increased fossil comparative sample to include representatives of Homo heidelbergensis, which is underrepresented in our study. The Megalopolis molar contributes to the scarce Pleistocene human fossil record of Greece and highlights the potential of the Megalopolis Basin for yielding further paleoanthropological finds.
Introduction
The Megalopolis Basin, Peloponnese, Greece, is well-known for its fossil fauna (e.g., Skoufos 1905; Melentis 1961; Sickenberg 1976; Athanassiou 2018; Athanassiou et al. 2018) and more recently for its Middle Pleistocene archaeological sites (e.g., Panagopoulou et al. 2015; Giusti et al. 2018; Thompson et al. 2018; Konidaris et al. 2019). The most important of these, Marathousa 1, has yielded a stratified lithic as well as faunal assemblage including elephant remains showing signs of butchery (e.g., Tourloukis et al. 2018a; Konidaris et al. 2018). The site has been dated to 400-500 ka (Blackwell et al. 2018; Jacobs et al. 2018), testifying to an early human presence in the region. In contrast to these recently discovered sites, many of the earlier paleontological finds from the Megalopolis Basin are non-stratified surface finds. Surface finds can be transported and can originate from varying exposed surfaces in the proximity of the find spot, which complicates their dating (Wandsnider 2004). In the case of the Megalopolis area, exposed surfaces span a wide geological age range (Siavalas et al. 2009; Vinken 1965). In 1962-63 an isolated human tooth was found on the surface in the basin and recovered together with Pleistocene fossil faunal remains (Sickenberg 1976; Marinos 1975). This putative fossil human specimen is a left upper third molar, hereafter referred to as the Megalopolis molar (Fig. 1). Its geological age and species attribution are unknown because of its problematic context as surface find, as well as its state of preservation.
The Megalopolis molar was first described during the analysis of the faunal remains collected at the same time (Marinos 1975). It was proposed that the Megalopolis molar has a similar age as the fauna. The faunal assemblage was assigned to the “Biharium” (Sickenberg 1976), which roughly translates to the lower half of the Middle Pleistocene and the Early Pleistocene (Koenigswald and Heinrich 2007). If Sickenberg’s assessment was correct, the Megalopolis molar would be one of the oldest hominin fossils known in Europe at the time of its discovery. In some cases, ESR and U-series dating enable direct dating of teeth (e.g., Duval et al. 2012). In the case of the Megalopolis molar, direct dating has not been attempted due to previous chemical treatment (Xirotiris et al. 1979) but also because of the destructive nature of these dating methods. Because of its status as a surface find without datable surrounding context, its fossil status is uncertain, as it could potentially derive from a recent, modern human skeleton (Marinos 1975).

Xirotiris et al. (1979) analyzed the enamel prism structure via scanning electron microscopy (SEM) with the aim to classify the Megalopolis molar. For this purpose, a part of the crown was cleaned with acid to remove the enamel surface layer, which does not show a prism structure (Xirotiris et al. 1979). The SEM method usually requires a thin gold or platinum coating of the sample to improve contrast and the signal-to-noise ratio (Carter and Shieh 2015: 117–144). Remnants of the gold coating are still visible on the fossil (Fig. 1 a-e). It is assumed that the gold coating was at least partly removed by acid due to the concomitant removal of labeling on the crown (cf. Fig. 1, Xirotiris et al. 1979: 118), which resulted in the obliteration of its crown features. The authors of that study did not reach a species attribution due to the limited comparative sample of fossil human enamel prism structures and an overlap in the linear crown measurements of the Megalopolis molar with several Homo species (Xirotiris et al. 1979).
The preservation of the Megalopolis molar is problematic for most standard methods used to assess external morphology. The absence of its roots and the eroded condition of its occlusal surface limit analysis to internal structures and overall shape of the tooth crown. Dental outline analysis provides a framework in which teeth can be analyzed independent of their absolute size, presence of the dental root and to a certain degree occlusal wear (see, e.g., Benazzi et al. 2011a, 2012). On other tooth types the cervical and crown outline analyses were successfully used to distinguish between Neanderthals and Homo sapiens as well as between fossil Homo sapiens and recent populations (e.g., Benazzi et al. 2011a, 2011b; Harvati et al. 2015). For the analysis of the cervical outline, the preservation of the Megalopolis molar would require reconstruction to avoid introducing a possible source of error because parts of this outline are missing. In contrast, an analysis of the crown outline is possible without reconstruction. In this chapter, we show that the method of crown outline analysis can be applied on upper third molars and thereby help shed light on the taxonomic status of the Megalopolis molar.
Material and Methods
Crown outline analysis on upper third molars
Tooth outlines can be analyzed by direct extraction of diameters, diagonals, and area or by geometric morphometric analysis of landmark data collected on the outline. We analyzed landmark data collected on the crown outline of the Megalopolis molar to allow the consideration of its shape as well as its form (defined as shape considered together with size). It is important to note that landmark data collected on outlines do not strictly fall into the classical concepts of fixed landmarks and semi-landmarks because of the lack of homologous fixed points and start or end points of the outline curve, respectively (for discussion of landmark types see, e.g., Bookstein 1991; Gunz et al. 2005). Therefore, the required removal of orientation, location and absolute size from the landmark coordinates cannot be achieved by a Generalized Procrustes analysis (GPA) alone. A geometric morphometric analysis of a dental outline requires additional specific steps during data collection to remove orientation and ensure homology between landmark configurations (Bauer et al. 2018; Harvati et al. 2015).
Prior to the data collection, consistent orientation was identified as possible source of error due to the high intraspecific variation of third molars (e.g., Gómez-Robles et al. 2012; Schneider et al. 2014). We used only upper third molars (M3) with a mesial contact facet to the second molar or with a very distinct crown that immediately allowed the identification of the mesial side to minimize this source of error. Landmark data of the crown outline were collected by two observers (C.R.; J.Z.) on 39 μCT scans from original specimens with their resolution ranging from 10.3 to 36.3 μm (Table 1). The M3 landmark data showed a very high interspecific homogeneity. Almost all individuals exhibit differences of less than 0.05 mm in their centroid size (CS) corrected landmark coordinates. In addition, one modern human specimen (Tunisia 80) was digitized five times each by two observers (C.R.; J.Z.) over the period of six months in order to evaluate intra- as well as interobserver error.
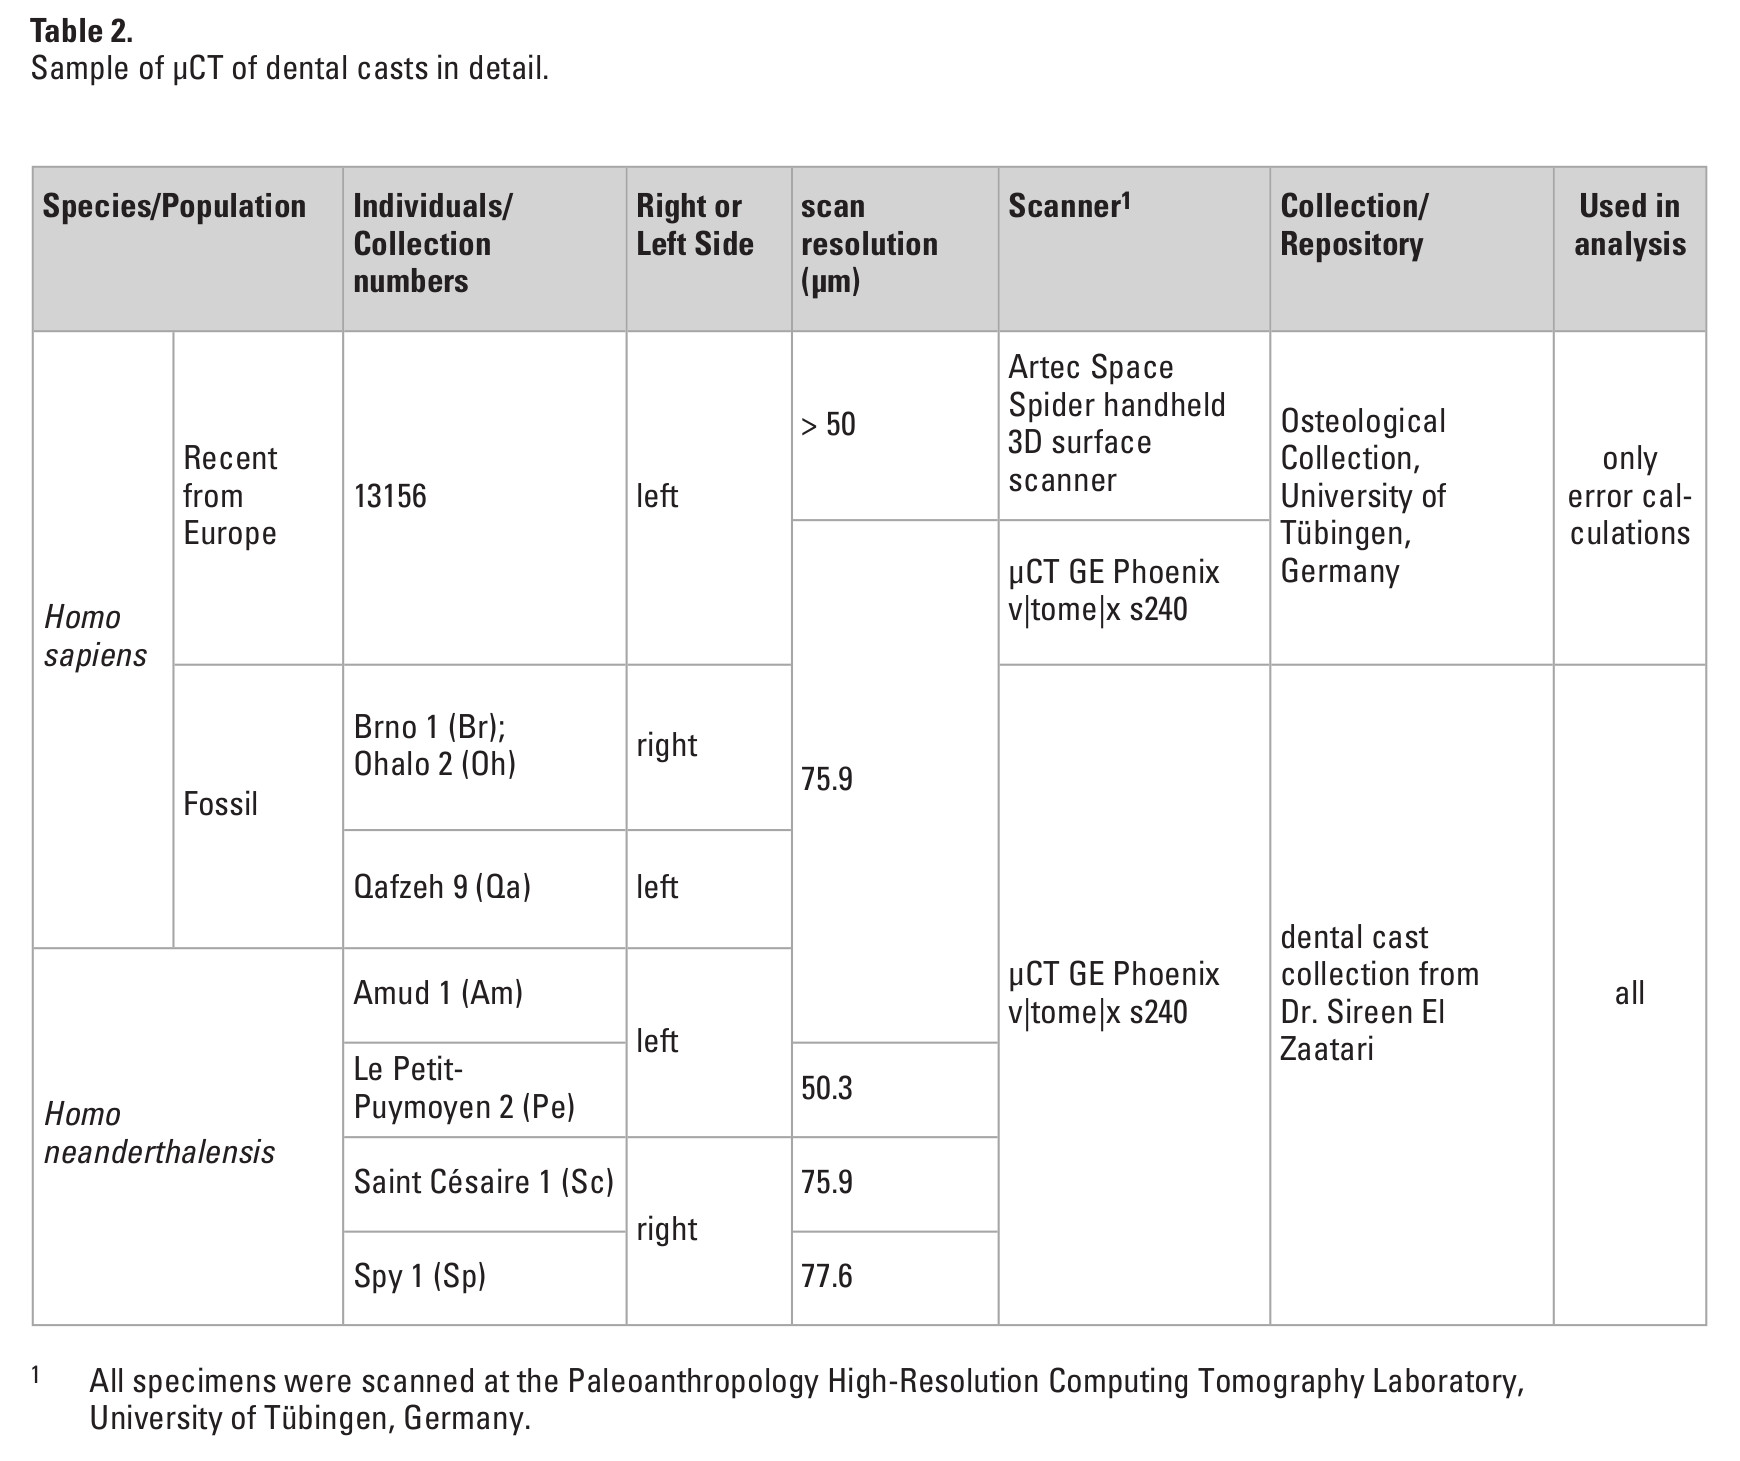
Dental casts are a source of information often neglected in geometric morphometric studies of dentition. Especially in cases when the access to CT scans is restricted, casts can provide a valuable addition to the comparative sample. Landmark data were collected by one observer (C.R.) on seven μCT scans of high resolution dental casts from fossil individuals (resolution ranging from 50.3 to 77.6 μm; Table 2). Only casts with clearly visible cervical lines were scanned and included in our analysis. To evaluate inter-method error, a high resolution dental cast of one modern human individual from the μCT scan sample (Vaihingen 13156) was created. Subsequently the cast was both μCT scanned and surface scanned. Landmark data were collected five times each from the μCT scan of the original tooth, the μCT of the cast and from the surface scan of the cast over a period of six months by one observer (C.R.).

The following protocol includes all data collection steps necessary for geometric morphometric analysis of the crown outline (Fig. 2). All teeth from the right side were mirror-imaged and treated as teeth from the left side in all subsequent steps. Mirroring of anatomical antimeres is often used to expand sample size (e.g., Bauer et al. 2018; Harvati et al. 2015). It has to be noted that combining right and left teeth might increase noise, since fluctuating asymmetry is the norm in dentition (e.g., Scott et al. 2018; Sprowls et al. 2008). An orientation system based on the cervical line ensured repeatability of the spatial positioning and orientation (Benazzi et al. 2009). A best-fit plane along the cervical line was calculated and the tooth virtually sectioned along this plane. The best-fit cervical plane was translated to the x-y plane of a coordinate system to establish a relationship between the measured crown outline and the cervical plane. In addition, this enabled a consistent orientation of the teeth. Each tooth was rotated until the mesio-distal axis was parallel to the x-axis with the mesial side pointing towards higher values along the x-axis. A standardized occlusal view with a 90° angle to the x-y plane was used to project the crown outline onto the x-y plane (Benazzi et al. 2011a, 2012). The projected outline’s area centroid was calculated and translated to a predetermined point, here 10,10,0. Sixteen radii were digitized at an angle of 22.5° to each other outgoing from the centroid (Bauer et al. 2018; Benazzi et al. 2012). The points of interception between the radii and the crown outline created a set of 16 two-dimensional landmarks per tooth. The landmark set was statistically analyzed after scaling it to centroid size (CS) and removing location from the scaled landmark data. The CS is calculated as the square root of the summed squared of each landmark-centroid distance (Zelditch et al. 2012). A partial GPA with inhibited rotation was performed to remove scale and location at the same time. All steps of data collection were carried out in the software environments of Avizo 9.2 (FEI Visualization Sciences Group) and Rhinoceros 6 (Robert McNeel and Associates, Seattle, WA). Statistical analyses were carried out in R (R Development Core Team 2011) using published and freely available code (GPA: Morpho package; following error calculations: Morpho, geomorph, and stats packages).

The relative reproducibility of individual landmarks was assessed by calculating the error in percent of the Euclidean distance (ED) between the configuration centroid and repeat measures of each landmark in the configuration (Fig. 3a; Singleton 2002). The EDs were calculated based on the raw, not scaled landmark configurations. For each observation the configuration’s centroid and the 16 ED’s between the centroid and each landmark were computed. Percentage error was calculated for each landmark, and within and between observers the average deviation was determined. The measured error was below five percent in all cases, which is commonly seen as the maximum of acceptable deviation between repeated measurements. The two landmark positions with the smallest ED to the configuration’s centroid showed the highest error percentages in all cases, inter-method, intraobserver as well as interobserver error. This is considered a side effect when the configuration deviates from a circular or spherical shape and of small landmark configurations (von Cramon-Taubadel et al. 2007).
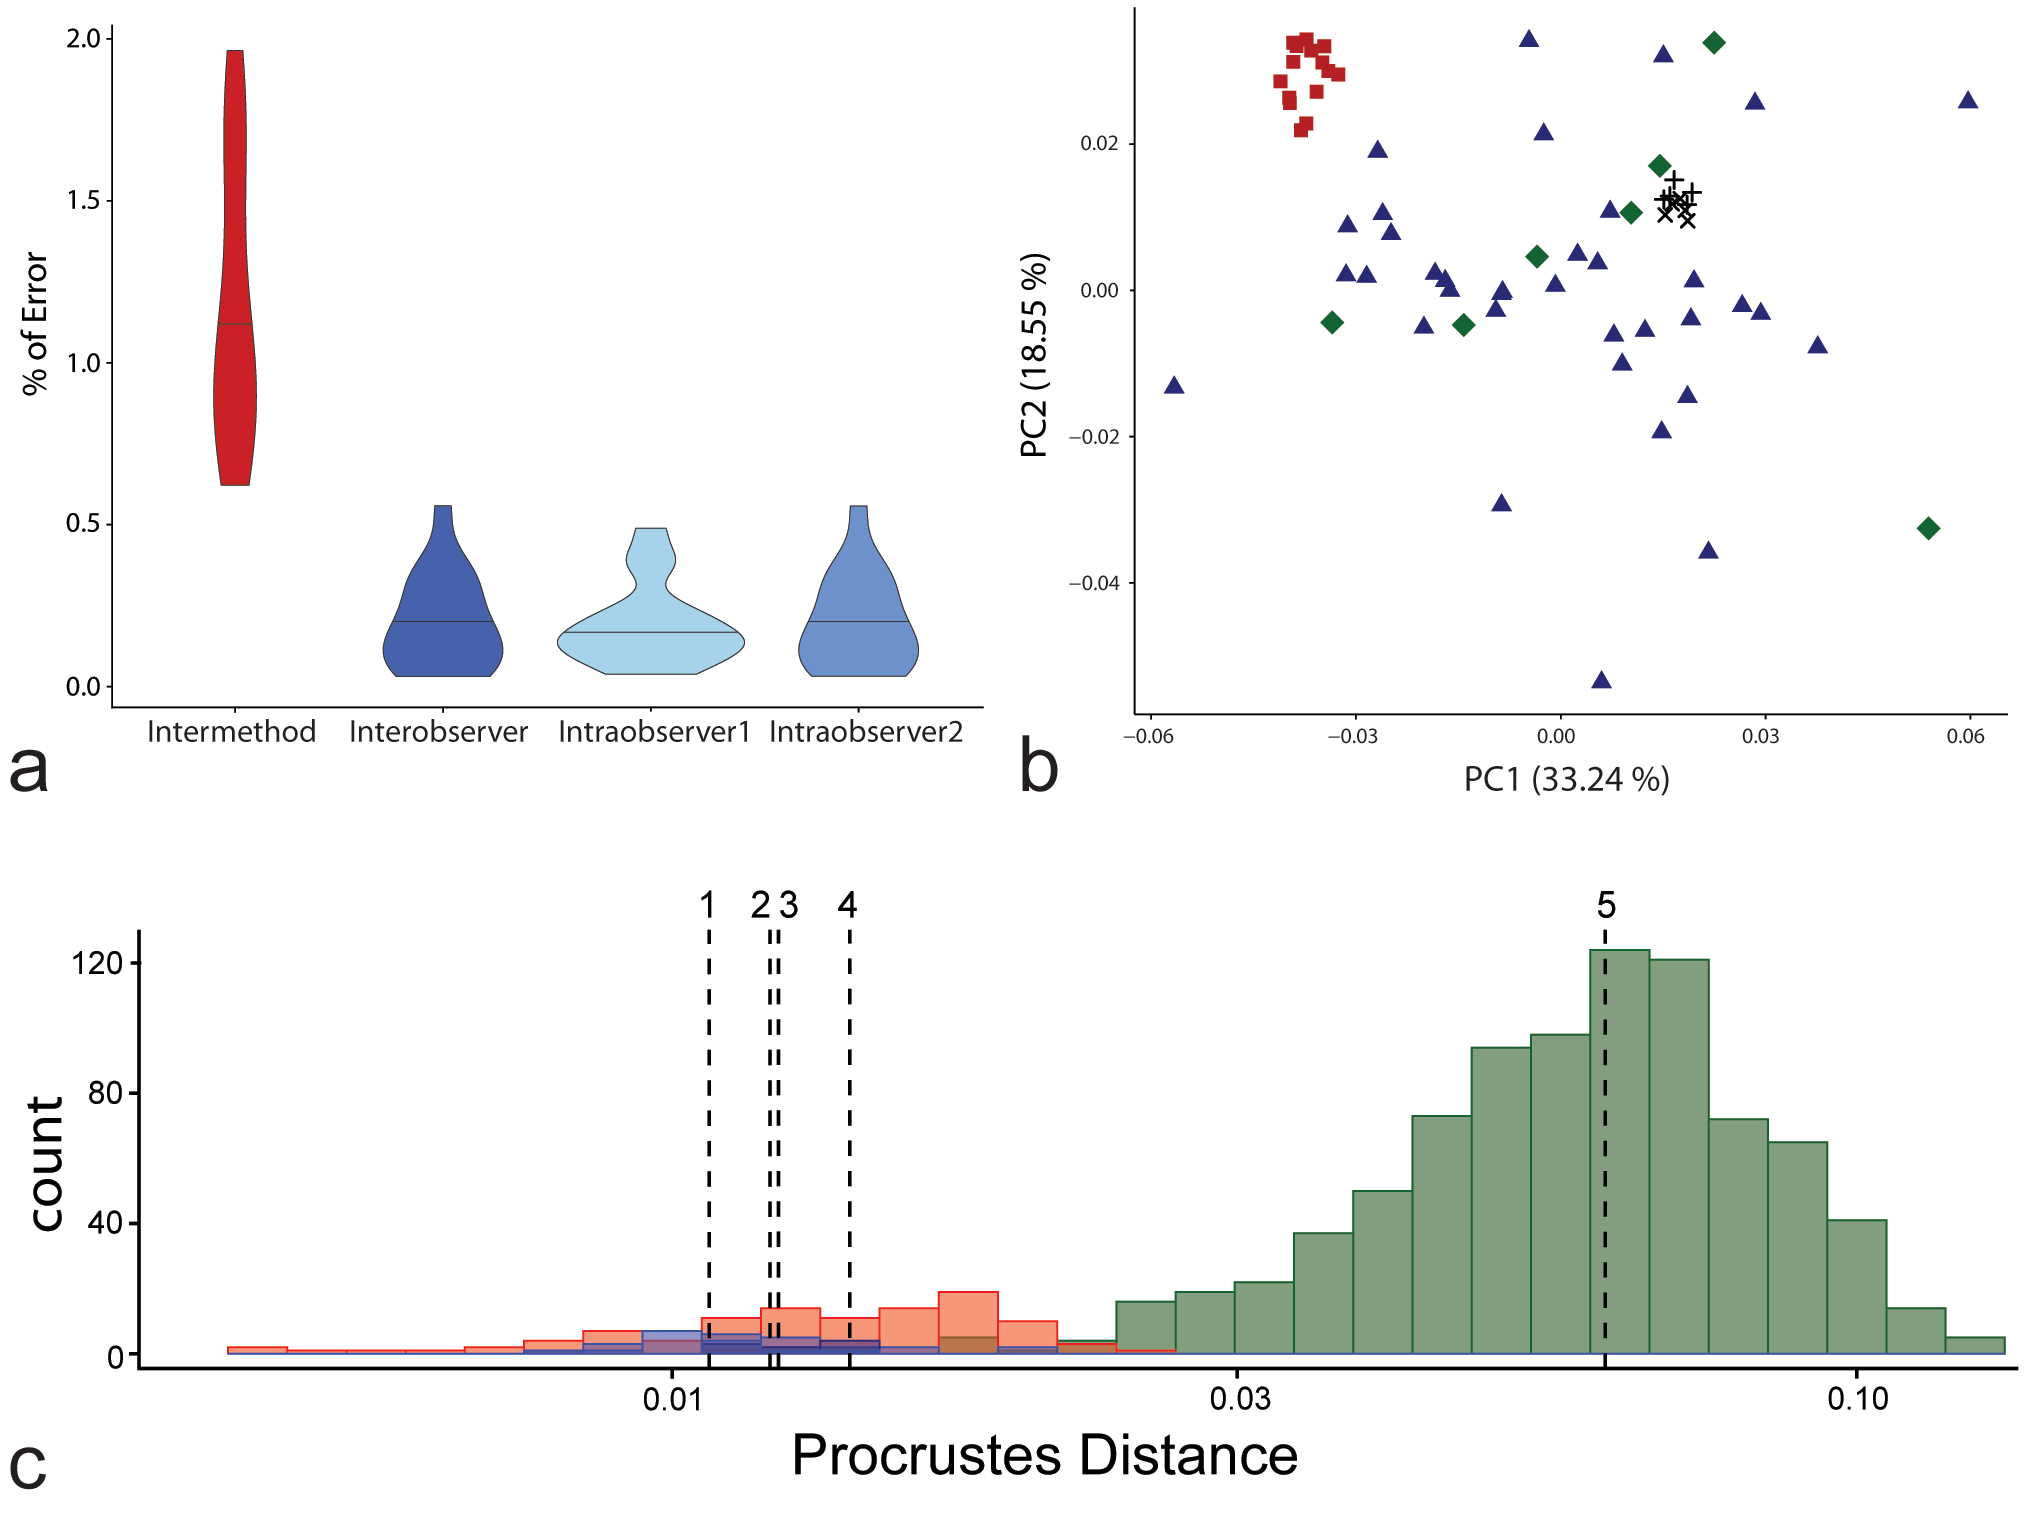
The effects of inter- and intraobserver as well as inter-method error were explored in a comparative sample composed of the above mentioned sample of μCT scans (Fig. 3b-c). Pairwise Procrustes distances (PD) between multiple measurements of the same individual were compared to interindividual distances assuming that specimen affinity is not influenced when the largest PD between repeated measurements of the same individuals is smaller than the smallest PD between different specimens (Neubauer et al. 2009). The PDs were calculated based on the scaled and GPA superimposed landmark configurations. Due to the very homogenous sample, the interobserver and inter-method error overlapped with the smallest distances between individuals (Fig. 3c). The highest PDs between repeated inter-method measurements were found in surface scans. Pairwise PDs between measurements on surface scans and the comparative sample were smaller than PDs to other inter-method measurements on CT scans. In contrast, all inter- as well as intraobserver measurements showed smaller PDs to each other than to other individuals. Both intraobserver errors showed values smaller than the smallest interindividual PD. All mean errors were more than four times smaller than the interindividual distance mean.
When projecting the repeated interobserver measurements into a Principal Component Analsysis (PCA) in shape space the measurements clustered together (Fig. 3b). No other individual plotted into the space between the repeated interobserver measurements. Likewise, the intermethod measurements clustered together (Fig. 3b). The higher error in surface scans was reflected by some measurements being more scattered. A possible explanation is the less secure identification of the cervical line on the surface scans due to problems in capturing the lower part of the crown during the surface scanning. Therefore, surface scans of dental casts were excluded from further analysis due to their potential influence on the results.
Crown outline analysis of the Megalopolis molar
The cervical line on the Megalopolis molar shows damage especially on the lingual and distal sides (Fig. 1). Contrary to the illustrated surface model, the μCT scan showed the original boundary between dentin and enamel on the majority of the tooth. A best-fit cervical plane was therefore computed based on this visible part of the original and not the damaged enamel-dentin boundary.
The crown outline of the Megalopolis molar was compared to a sample of modern as well as fossil Homo sapiens, Neanderthals, two Homo erectus individuals from Sangiran and the Homo heidelbergensis individual from Steinheim (Tables 1, 2). The majority of the comparative sample consisted of CT scans of the original specimens with the addition of seven μCT scans of high resolution dental casts.
Multivariate Statistics
All following multivariate statistics were calculated in R (R Development Core Team 2011, packages: Morpho, geomorph, stats, MASS). The PCA is a method to reduce high-dimensional space to interpret large-scale trends of data and is subject to mathematical assumptions (Abdi and Williams 2010). For the shape PCA only the scaled and superimposed landmark coordinates were used, whereas for the form PCA, CS was added as variable. The most important assumption of this method is that the dataset does not contain outliers or influential individuals. This assumption was tested on the comparative sample (the Megalopolis molar was not used to calculate the PCAs but was projected into the plots). Cook’s distance was estimated for each individual and influential individuals were identified by using the cutoff values recommended by Bollen and Jackman (1985). One individual, Qafzeh 9, reached the sensitive cutoff of 4/N, here N = 45 and α = 0.05, in shape space as well as form space. An omission did not alter the pattern of results and the individual was not excluded from the analyses so as not to further limit our already small fossil Homo sapiens sample. In addition, the PC scores, including those of Qafzeh 9, did not show any outliers when using the ± 3 standard deviations criterion.
Shape changes along the PCs (Figs. 4, 5) were visualized as landmark configurations at ± 2 standard deviations (sd). The landmark configurations were calculated by rotating and translating PC-scores derived from shape data back into configuration space. Therefore, the coefficients of the PC, which express the relationship between the PC and the original variables, were used to predict a hypothetical landmark configuration outgoing from a PC score ± 2 sd from the PC mean. PC-scores were converted to landmark coordinates in R (R Development Core Team 2011, packages: Morpho). Convex hulls were calculated around the extreme points of each defined group and contain no information about confidence intervals.
To further explore the relationship between shape and size in our sample, a linear regression between shape and logarithmized CS was calculated. Due to its influential Cock’s distance, Qafzeh 9 was excluded for this analysis. To maximize sample size, all superimposed landmark coordinates from Homo sapiens and Neanderthals were pooled (N = 41). The regression was calculated in R with a function that performs statistical assessment based on Procrustes distances among specimens, rather than explained covariance matrices among variables (Adams et al. 2020: proc.lm function).
Results
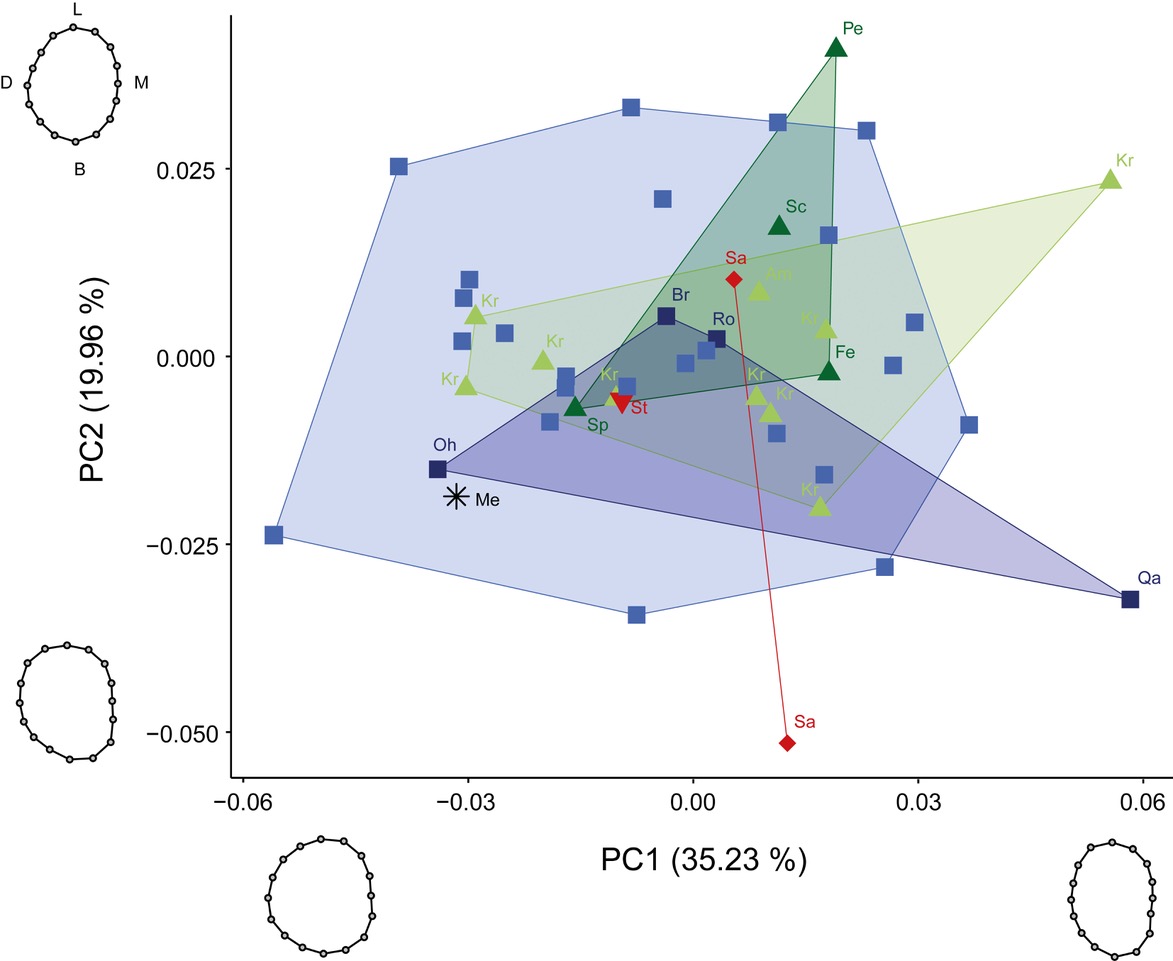
The first two shape PCs explained 55.19% of variance and their combination showed no clear separation between groups (Fig. 4), a pattern which is repeated by all higher PC’s. PC1 explained 35.23% of variance and summarized shape changes ranging from a bucco-lingual elongated oval outline with parallel mesial and distal sides (positive values) to a bucco-lingual compressed rounder outline with an outward bulging of the distal side (negative values). Teeth expressing a more positive value showed a reduction of the distal cusps on the occlusal surface compared to teeth with more negative values that showed four well developed cusps. PC2 explained 19.96% of variance and described shape changes from an outline with bulging on the lingual part of the distal side (negative values) to an outline with bulging on the buccal part of the lingual side (positive values). A reduction of the hypocone relative to the metacone was expressed by teeth showing positive values. In contrast, a reduction of the metacone relative to the hypocone was expressed by teeth showing negative values. When projecting the Megalopolis molar into the PCA plot, it plotted among the negative values of both PC1 and PC2, reflecting its four developed cusps with a slight reduction of the metacone. The Megalopolis molar plotted into the modern Homo sapiens convex hull and close to the fossil Homo sapiens from Ohalo II.
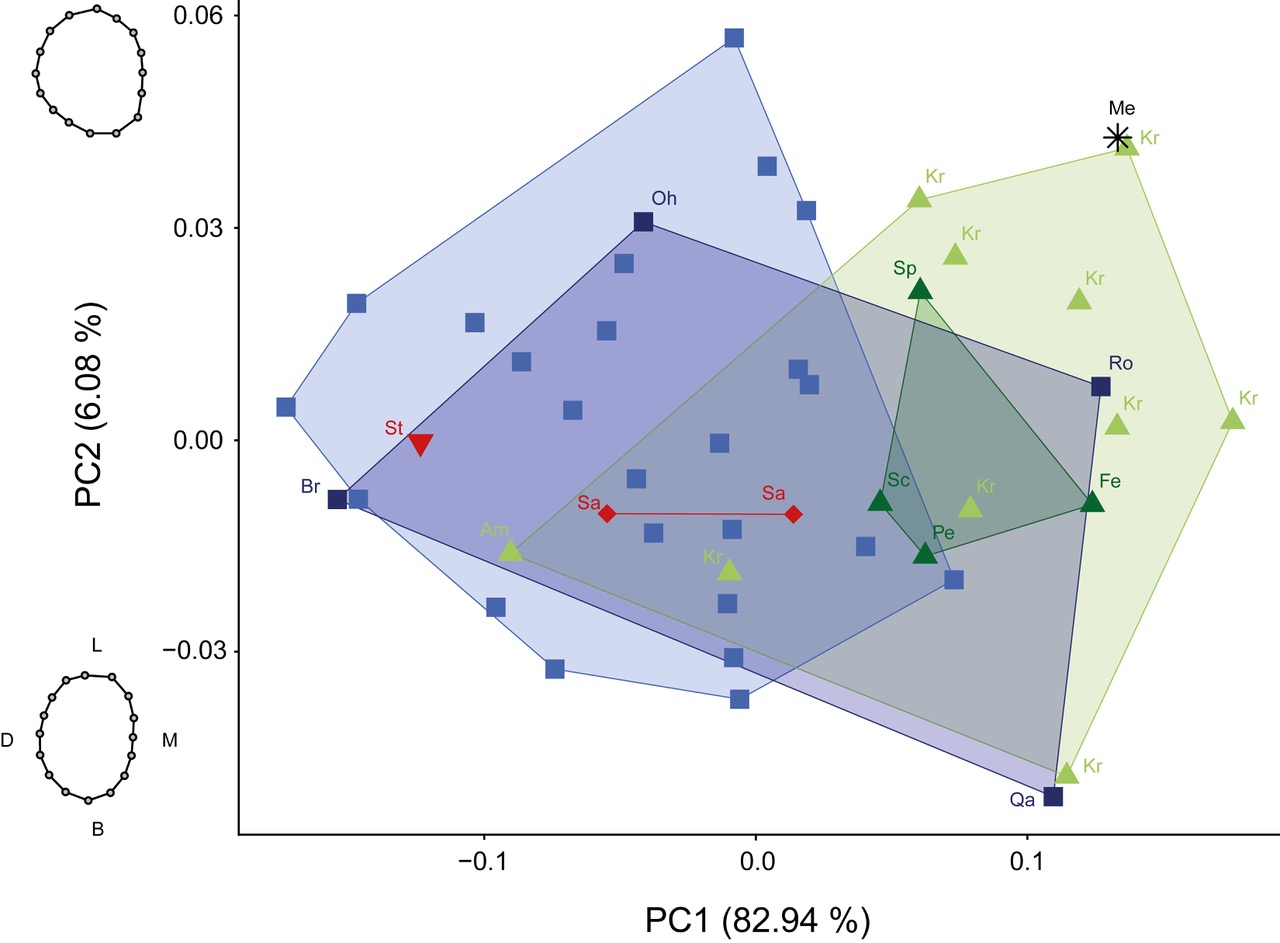
The form PCA combines the scaled, superimposed landmark data with the variable of CS (Fig. 5). PC1 explained 82.94% of variance and was highly positively correlated with CS. PC2 explained 6.08% of variance and summarized shape changes ranging from a bucco-lingual elongated oval outline with parallel mesial and distal sides (negative values) to a bucco-lingual compressed rounder outline with an outward bulging of the distal side especially disto-lingual (positive values). Teeth expressing more negative values showed the reduction of both distal cusps while more positive values showed four well developed cusps with a slightly more pronounced hypocone relative to the metacone.
On the one hand, PC1 in form space reflected a high interspecific homogeneity by explaining 82.94% of variation. On the other hand, PC1 separated most of the Neanderthals individuals with positive values from the modern Homo sapiens with rather negative values. Overall, the PCA plot showed varying degrees of overlap between all groups and large intraspecific variation. Two fossil Homo sapiens, La Rochette and Qafzeh 9, showed the most positive values along PC1 for all Homo sapiens and thereby, plotted closer to Neanderthals than other Homo sapiens. The Neanderthal individuals Amud 1 and Krapina d097 plotted within the modern Homo sapiens. The chronologically older individuals from Steinheim and Sangiran plotted into the modern Homo sapiens variation. When projecting the Megalopolis molar into the PCA plot, it plotted in the positive values of PC1 and PC2, and thereby away from the Homo sapiens convex hulls. Krapina d178 plotted closest to the Megalopolis molar and showed the greatest resemblance in overall shape based on PD. Their pairwise PD was in a similar order of magnitude as the reported mean interobserver error. The Megalopolis molar would still plot outside of the Homo sapiens convex hulls and closest to Neanderthals from Krapina when assuming a circular error range with the plotted distance to Krapina d178 as radius.
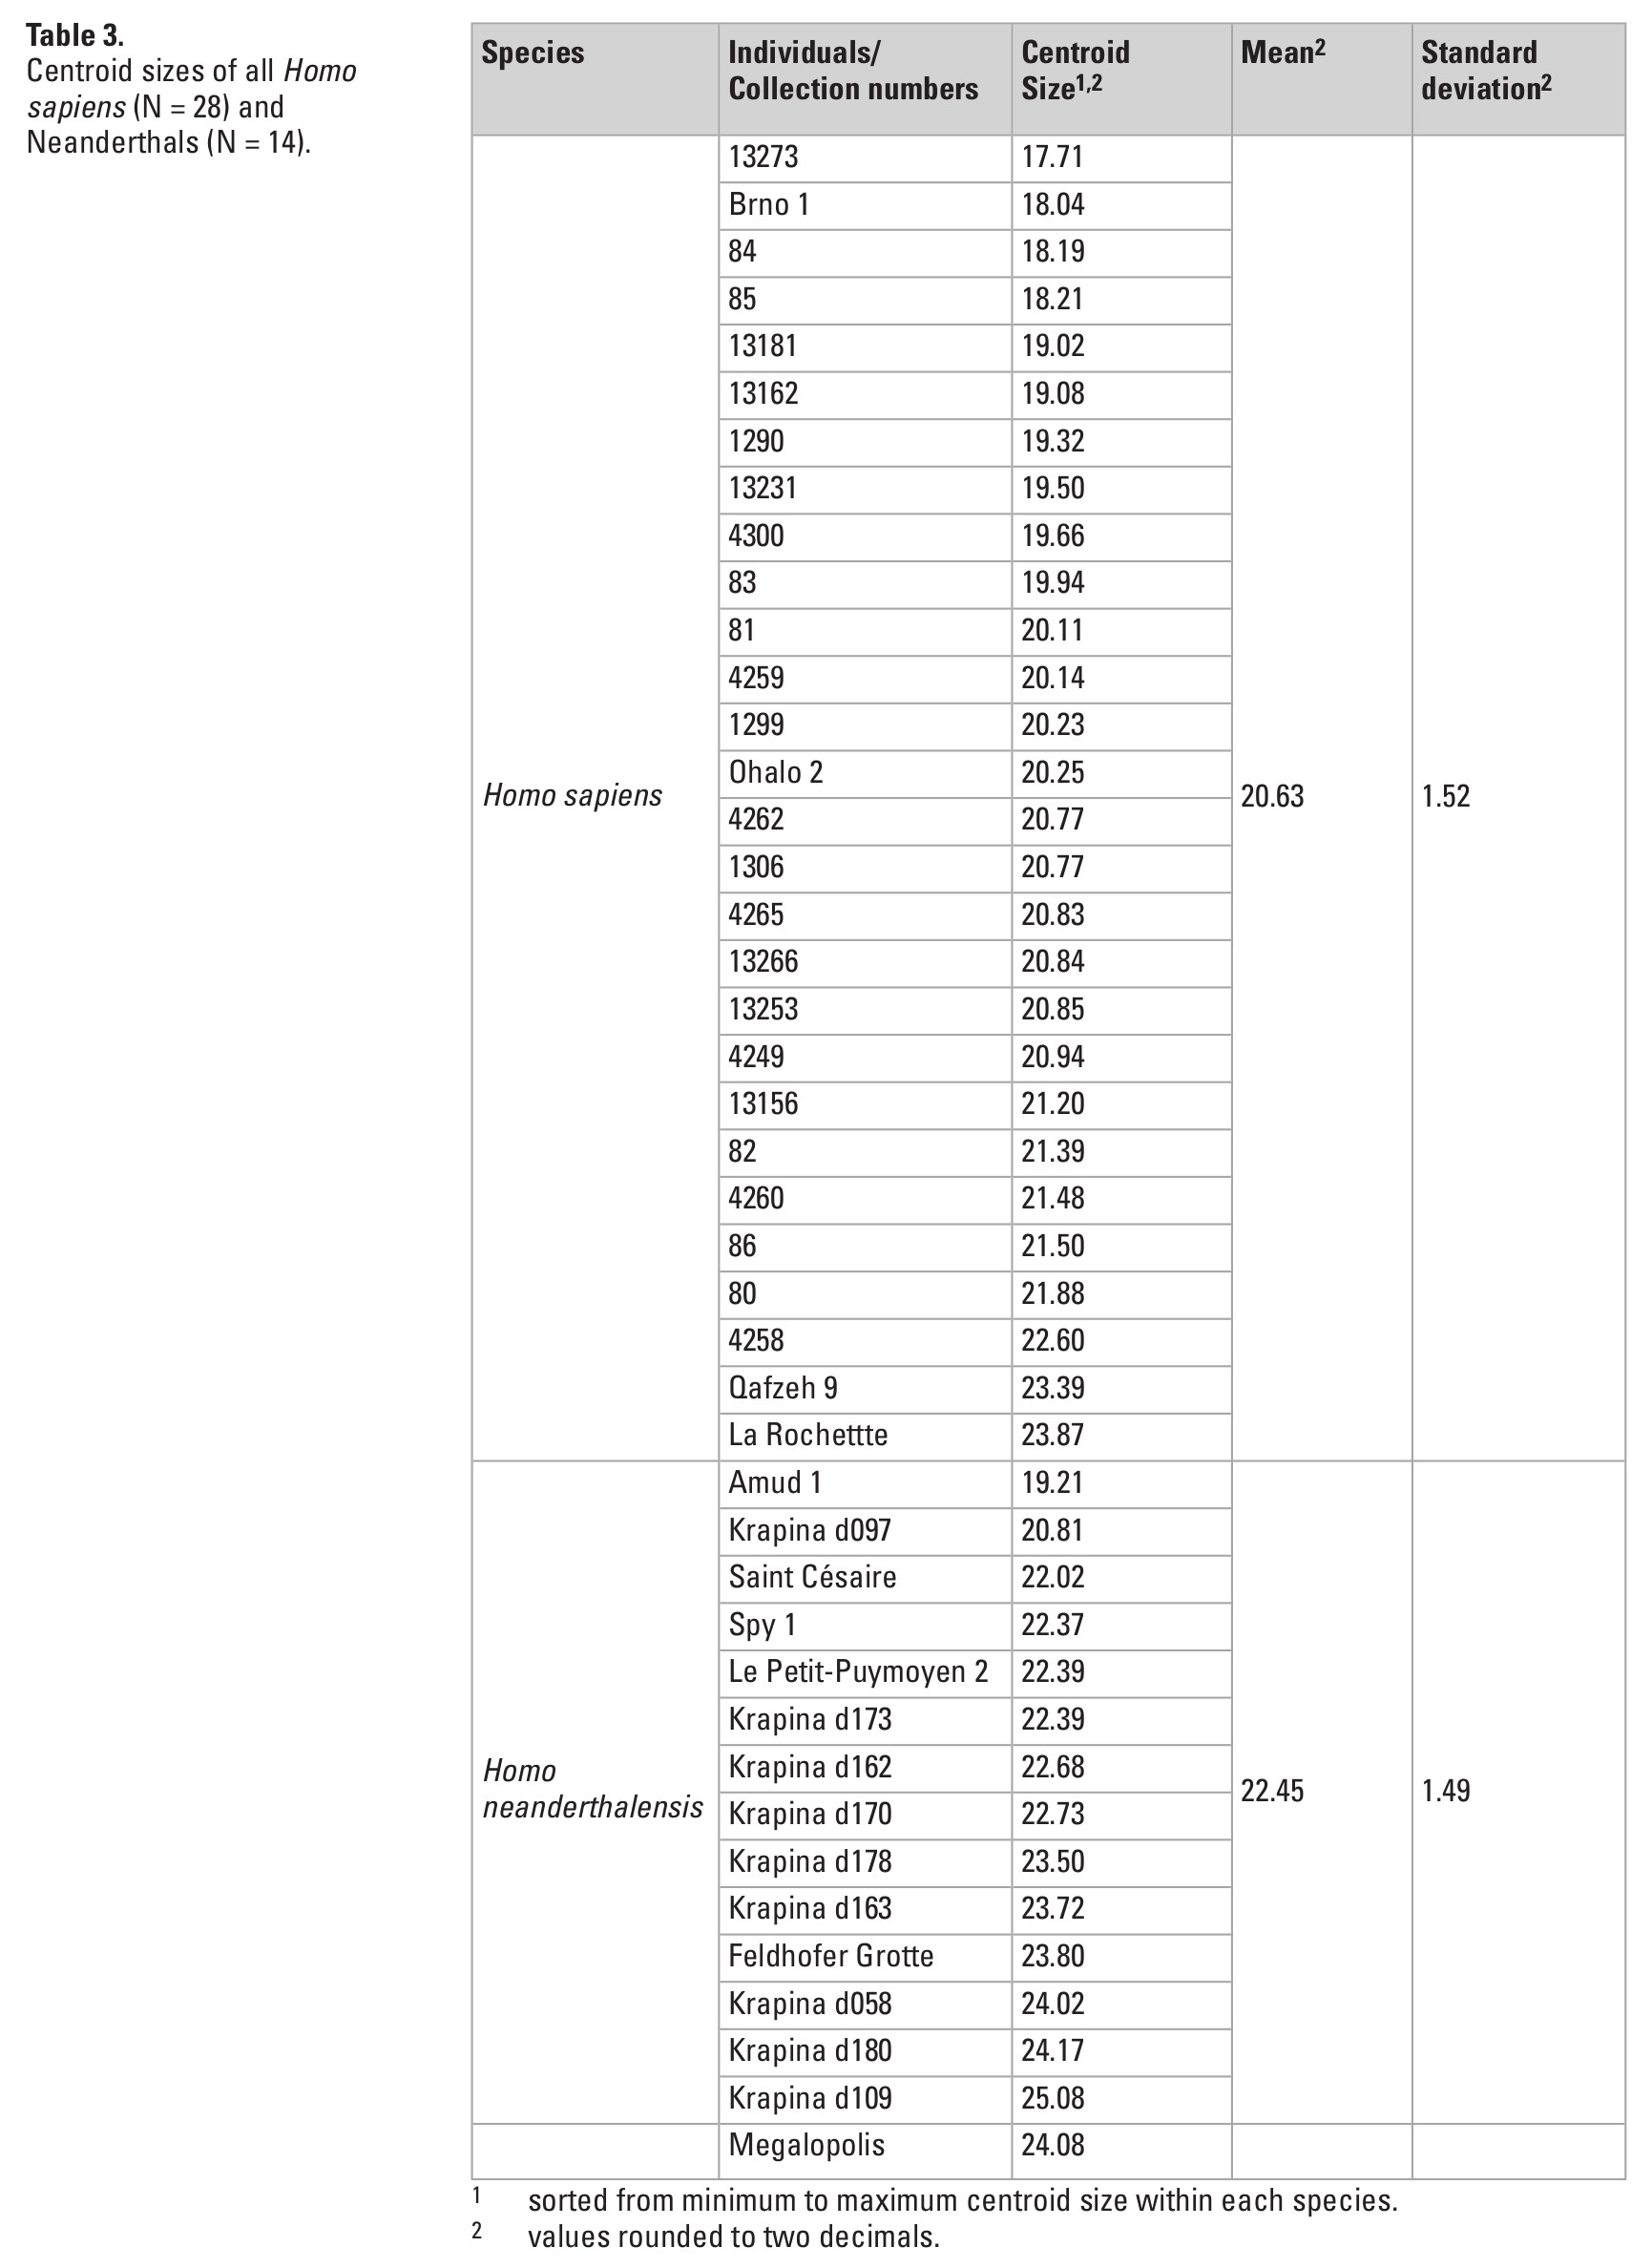
CS in our sample ranges from 17.71 to 25.08 (Table 3), with Neanderthals on average showing higher values (mean: 22.45 ± 1.49) than Homo sapiens (mean: 20.63 ± 1.52). Megalopolis showed a CS of 24.08. No statistically significant relationship between shape and size was found (F = 1.14, Dof = 1, R2 = 0.03, p = 0.29; α = 0.05).
Discussion
A high degree of variability in distal maxillary molars in both fossil as well as recent populations is repeatedly reported in the literature (e.g., Bailey 2002; Macho and Moggi-Cecchi 1992; Martinón-Torres 2006). This observation was reflected in the high intraspecific variation in shape space (Fig. 4). Nevertheless, the size corrected superimposed landmark coordinates of many individuals showed differences of less than 0.05 mm. On the one hand, it implies that the crown outline alone does not capture certain aspects of the crown morphology, e.g., the position of fissures and cusps. On the other hand, it implies that even these subtle differences can potentially be informative and therefore error measurements should not be purely based on Euclidean distances (ED). The traditionally accepted error range for EDs is up to five percent. In case, of M3s five percent deviation between repeated measurements could be up to four times higher than the difference between individuals at this one landmark position.
Besides high intraspecific variability, an expanded fossil sample spanning Australopithecines to recent Homo sapiens showed that a hypocone reduction in M3s characterizes later Homo, like Homo sapiens and Neanderthals (Gómez-Robles et al. 2012). In addition, Gómez-Robles et al. (2012) found a higher level of metacone reduction in Homo sapiens than in Neanderthals. We could not analyze hypocone reduction to the same level of resolution, as our sample almost exclusively consists of later Homo. The PCA in shape space (Fig. 4) showed varying degrees of hypocone and metacone reduction for all groups. In our sample, only six Homo sapiens, Sangiran 7-17, and Krapina d170, as well as Megalopolis, show signs of metacone reduction. Ohalo II, Krapina d170 and Megalopolis express almost identical values along PC2, which described the metacone reduction. It has to be noted that Gómez-Robles et al. (2012) analyzed a different landmark set which provided additional information about the occlusal surface that is absent in our analyses. Further differences in methodology include the data acquisition from photographs and the use of sliding curve semi-landmarks by Gómez-Robles et al. (2012). A curve requires a homologous point, which provides the start for a predefined number of equidistantly spaced semi-landmarks on the curve (e.g., Gunz et al. 2005). Identification of the homologous start point is highly dependent on the orientation, here the position of the tooth during photographing, as well as preservation and occlusal wear. However, the preservation of the Megalopolis molar does not allow a secure identification of the landmarks on the occlusal surface nor a homologous start point for a curve of semi-landmarks.
Beyond shape differences, dental size, and especially linear measurements are commonly used to discriminate between both fossil and recent populations (e.g., Harvati et al. 2003, 2013; Smith et al. 2015; Xing et al. 2014). Xirotiris et al. (1979) reported a mesio-distal breadth 9.1 mm and a bucco-lingual length of 10.3 mm for the Megalopolis molar, which was at the lower end of their measurements for Neanderthals and Homo sapiens. In contrast, when using CS as a measure of size, the Megalopolis molar falls slightly outside the range of variation of our Homo sapiens comparative sample and at the upper end of the Neanderthal range (Table 3). The difference is that CS is based on multiple aspects (landmark coordinates) of the tooth while a linear measurement captures a single aspect of the tooth. For example, mesio-distal and bucco-lingual measurements hardly take into account reductions of one distal cusp. Nevertheless, both linear measurements and CS show the same trend that, on average, Neanderthals have larger M3s than Homo sapiens (e.g., Harvati et al. 2013; Xirotiris et al. 1979).
Macho and Moggi-Cecchi (1992) suggested that simplification in M3 morphology is partially caused by a reduction in size. The PCA in form space (Fig. 5) showed no relationship between shape and size in our sample of M3s. Larger teeth (PC1 positive values) varied in their morphology from completely reduced distal cusps to four well-developed cusps with only a slight reduction of the metacone. This reflects a common issue regarding allometric relationships in the hominin dentition. On the one hand, some studies have assumed or established no clear allometric effects in hominin dentition (e.g., Wood et al. 1983; Bailey and Lynch 2005). On the other hand, additional studies have suggested small but significant allometric relationships (e.g., Martinón-Torres et al. 2006; Gómez- Robles et al. 2008). It can be assumed that allometric effects do not explain morphological changes over an evolutionary time span, but might have some impact on patterns of intraspecific morphological variation (Gómez-Robles et al. 2012).
The process of dental development is multifactorial and thereby dental morphology is influenced by genetic, epigenetic and environmental factors (Brook et al. 2014a, 2014b). Genetic admixture might partially explain the observed overlap between Homo sapiens and Neanderthals in form space (Fig. 5). The two fossil Homo sapiens La Rochette and Qafzeh 9 plotted closer to Neanderthals than other Homo sapiens while the Neanderthal individuals Amud 1 and Krapina d097 plotted within the modern Homo sapiens. Genetic evidence suggests admixture between Neanderthals and Homo sapiens in the Middle and Late Pleistocene (e.g., Green et al. 2010; Posth et al. 2017; Sankararaman et al. 2012). Therefore, admixture cannot be ruled out entirely as a possible explanation for the observed morphology of La Rochette, Qafzeh 9, Krapina d097 and Amud 1. Admixture and genetics are based on the heritability of traits. Biological distance studies commonly use dental traits and often assume equal and additive inheritance of traits (e.g., Macchiarelli et al. 2008; Vargiu et al. 2009). However, non-additive genetic variation might preserve certain dental traits over time (Edgar and Ousley 2016). The chronologically older individuals from Steinheim and Sangiran plotted into the modern Homo sapiens variation or express an even more extreme metacone reduction (Figs. 4, 5). On the one hand, this might imply that some aspects of the crown outline in Homo sapiens are conserved and resemble the primitive state found in chronologically older groups. On the other hand, this might be an artifact of the high intraspecific variation in combination with the underrepresentation of Homo heidelbergensis and Homo erectus in our sample.
All in all, the two main components of the crown outline shape of the Megalopolis molar matched the variation found in the Holocene comparative sample. In contrast, outline form and overall shape did not match the Holocene sample. The form PCA, the Procrustes distances based on overall shape, as well as its centroid size, grouped the Megalopolis molar with the Neanderthal comparative sample. Although our samples were small, we cautiously interpret these results as indicating that the Megalopolis specimen likely dates to the Pleistocene and has affinities with the Neanderthal lineage.
It is important to note that our comparative sample lacked important individuals from the Middle Pleistocene of Europe (e.g., Petralona and Sima de los Huesos) and Africa (e.g., Broken Hill and Herto) and also many Neanderthal specimens. These were not possible to include due to a lack of access to dental casts or CT scans. A secure classification of the Megalopolis molar would require a more comprehensive sampling framework for the taxonomic interpretation and must be tested with further analyses and with an expanded comparative fossil sample.
The number of Neanderthal and pre-Neanderthal fossils from Greece has remained small even while the number of archaeological sites from the Middle and Lower Paleolithic has increased over recent years (e.g., Harvati 2016; Tourloukis and Harvati 2018). The oldest, radiometrically dated, Pleistocene site in Greece known to date, Marathousa 1, is located within the Megalopolis Basin. Marathousa 1 was dated to 400-500 ka (Blackwell et al. 2018; Jacobs et al. 2018) and provides a rich lithic as well as faunal assemblage (e.g., Tourloukis et al. 2018a; Konidaris et al. 2018). In contrast, the oldest human fossil, Petralona, commonly attributed to Homo heidelbergensis, or pre-Neanderthal, is not well dated (Dean et al. 1998; Hublin 1998, 2009). A Neanderthal presence in Greece was demonstrated by several Middle Paleolithic find spots and sites (Tourloukis and Harvati 2018), especially in the Mani Peninsula, Southern Peloponnese, where human fossil have also been recovered (e.g., Elefanti et al. 2008; Tourloukis et al. 2016). Three sites in Mani yielded Neanderthal remains: Lakonis (Harvati et al. 2003), Kalamakia (Harvati et al. 2013) and Apidima (Pitsios 1999; Harvati et al. 2019), dated to ca. 40 ka, between 100 and 40 ka, and to ca. 170 ka, respectively.
Although a direct or indirect dating is not available for the Megalopolis molar, the geology of the Megalopolis Basin suggests a Middle Pleistocene geological age, under the assumption that the molar is a fossil and not a modern intrusion. The Megalopolis Basin is a tectonic half-graben and filled with Neogene to Holocene sediments (Vinken 1965). Geological mapping showed that the surrounding hills consist of pre-Pliocene basement while the majority of the basin encompasses sediments of Pleistocene, especially Middle Pleistocene, origin (Siavalas et al. 2009). The Middle Pleistocene sediments can be divided into the Megalopolis member of the Choremi formation, which consists of fluvial deposits, and the Marathousa member, which consists of fossil-rich lacustrine deposits (Löhnert and Nowak 1965; Vinken 1965). On the grounds of paleomagnetic, cyclostratigraphic, biochronological and palynological data, the lacustrine sequence has been chronologically bracketed between ca. 950-350 ka (van Vugt et al. 2000; Okuda et al. 2001), or ca. 800-300 ka (Tourloukis et al. 2018b), with its upper age-limit being poorly constrained at around 300 or 200 ka (see also Jacobs et al. 2018; Blackwell et al. 2018). Recent multiproxy paleoenvironmental reconstruction (Bludau et al. 2021) has highlighted the role of the Megalopolis Basin as a potential glacial refugium for Pleistocene humans due to its ability to retain freshwater bodies during glacial periods. The Megalopolis molar was part of a surface collection, in which many of the collected fossils were found still embedded in blocks of lacustrine sediments and derived from deposits of the Marathousa Member (Sickenberg 1976: 26). Therefore, we hypothesize that the Megalopolis molar dates to the Middle Pleistocene and derives from the Marathousa Member of the Choremi Formation.
Future work should focus on expanding the comparative sample, especially the fossil sample of Neanderthals in order to span their entire spatial and temporal range, as well as representatives of Homo heidelbergensis, which are underrepresented in our study. Methods based on segmentation, e.g., analyses of the enamel dentine junction (EDJ), are limited by the state of preservation of the Megalopolis molar, which complicate the differentiation between enamel and dentine. Future improvements in CT scanning techniques might enable the latter and provide a more complete picture of the taxonomic affinities of the Megalopolis molar.
Conclusion
The case study of the Megalopolis molar demonstrates the necessity of analytical tools that allow the study of incomplete specimens. The method of crown outline analysis was applied to M3s and allowed the first quantitative study of the Megalopolis molar. On the basis of our results we conclude that the Megalopolis molar most likely represents a Pleistocene specimen with Neanderthal lineage affinities. The importance of the Megalopolis molar is threefold. First, it contributes to the Pleistocene human fossil record of Greece. Every new individual is valuable in adding to our understanding of human evolution in this relatively understudied region (see, e.g., Harvati 2016; Tourloukis and Harvati 2018). Second, the Megalopolis molar was found in the Megalopolis Basin, where the Middle Pleistocene site Marathousa 1 is also located. Both this specimen and the site highlight the potential of this region for yielding precious paleoanthropological finds. Furthermore, the present study adds to the examples of methodological improvements enabling new insights from known material, which could not be studied at the time of discovery due to its fragmentary status or taphonomic distortion.
Acknowledgements
We would like to thank Catherine C. Bauer and Vangelis Tourloukis for their useful comments and remarks about the methodology and geology of the Megalopolis Basin, respectively. We are grateful to Sireen El Zaatari for access to her collection of high resolution dental casts and her valuable comments, and to Panagiotis Karkanas for assistance with photographing the specimen. For access to the Megalopolis molar we thank the Faculty of Geology and Geoenvironment and the Museum of Paleontology and Geology, National and Kapodistrian University of Athens, as well as Vassilis Karakitsios, George Lyras, Hara Drinia and the late Nikolaos Symeonidis. We would like to acknowledge all institutions and researchers that provided CT scans for this research: NESPOS online database; the Staatliches Museum für Naturkunde Stuttgart for access to the Steinheim material; the Senckenberg Research Institute in Frankfurt am Main and Friedemann Schrenk for access to Sangiran 7-17; the Balai Pelestarian Situs Manusia Purba of Sangiran, Java, as well as Arnaud Mazurier, Clément Zanolli, Roberto Macchiarelli, Harry Widianto, Dominique Grimaud-Hervé and Françoise Sémah for access to Sangiran NG0802.1. In addition, we would like to acknowledge the assistance of the Paleoanthropology High Resolution Computing Tomography Laboratory at the Eberhard-Karls University of Tübingen, supported by the DFG INST 37/706-1, in scanning the dental casts and all used individuals from the osteological collection of the University of Tübingen. This research was supported by the European Research Council (ERC CoG no. 724703). We are grateful to the reviewers, Mirjana Roksandic and Hugo Reyes-Centeno, for their comments and suggestions.
References
Abdi, H., and L. Williams. 2010. Principal component analysis. Willey Interdisciplinary Reviews: Computational Statistics 2: 433-459. doi:10.1002/wics.101
Adams, D., M. Collyer, and A. Kaliontzopoulou. 2020. Geomorph: Software for geometric morphometric analyses. Version 3.2.1. Geomorph website.
Athanassiou, A. 2018. Pleistocene vertebrates from the Kyparíssia lignite mine, Megalopolis Basin, S. Greece: Rodentia, Carnivora, Proboscidea, Perissodactyla, Ruminantia. Quaternary International 497: 198-221. doi:10.1016/j.quaint.2018.06.042
Athanassiou, A., D. Michailidis, E. Vlachos, V. Tourloukis, N. Thompson, and K. Harvati. 2018. Pleistocene vertebrates from the Kyparíssia lignite mine, Megalopolis Basin, S. Greece: Testudines, Aves, Suiformes. Quaternary International 497: 178–197. doi:10.1016/j.quaint.2018.06.030
Bailey, S. E. 2002. Neandertal dental morphology: Implications for modern human origins. Ph.D. Dissertation, Arizona State University.
Bailey, S. E., and J. M. Lynch. 2005. Diagnostic differences in mandibular P4 shape between Neandertals and anatomically modern humans. American Journal of Physical Anthropology 126: 268e277.
Bauer, C. C., S. Benazzi, A. Darlas, and K. Harvati. 2018. Geometric morphometric analysis and internal structure measurements of the Neanderthal lower fourth Premolars from Kalamakia, Greece. Quaternary International 497: 14–21. doi:10.1016/j.quaint.2018.01.035
Benazzi, S., M. Fantini, F. De Crescenzio, F. Persiani, and G. Gruppioni. 2009. Improving the spatial orientation of human teeth using a virtual 3D approach. Journal of Human Evolution 56: 286–293. doi:10.1016/j.jhevol.2008.07.006
Benazzi, S., M. Coquerelle, L. Fiorenza, F. Bookstein, S. Katina, and O. Kullmer. 2011a. Comparison of dental measurement systems for taxonomic assignment of first molars. American Journal of Physical Anthropology 144: 342–54. doi:10.1002/ajpa.21409
Benazzi, S., K. Douka, C. Fornai, C. C. Bauer, O. Kullmer, J. Svoboda, I. Pap, F. Mallegni, P. Bayle, and M. Coquerelle. 2011b. Early dispersal of modern humans in Europe and implications for Neanderthal behavior. Nature 479: 525–529. doi:10.1038/nature10617
Benazzi, S., C. Fornai, L. Buti, M. Toussaint, F. Mallegni, S. Ricci, G. Gruppioni, G. W. Weber, G. W., Condemi, and A. Ronchitelli. 2012. Cervical and crown outline analysis of worn Neanderthal and modern human lower second deciduous molars. American Journal of Physical Anthropology 149: 537–546. doi:10.1002/ajpa.22155
Blackwell, B. A. B., N. Sakhrani, I. K. Singh, K. K. Gopalkrishna, V. Tourloukis, E. Panagopoulou, P. Karkanas, J. I. B. Blickstein, A. R. Skinner, J. A. Florentin, and K. Harvati. 2018. ESR Dating Ungulate Teeth and Molluscs from the Paleolithic Site Marathousa 1, Megalopolis Basin, Greece. Quaternary 1: 22. doi:10.3390/quat1030022
Bludau, I. J. E., P. Papadopoulou, G. Iliopoulos, M. Weiss, E. Schnabel, N. Thompson, V. Tourloukis, C. Zachow, S. Kyrikou, G. E. Konidaris, P. Karkanas, E. Panagopoulou, K. Harvati, and A. Junginger. 2021. Lake-level changes and their paleo-climatic implications at the MIS12 Lower Paleolithic (Middle Pleistocene) site Marathousa 1, Greece. Frontiers in Earth Science 9: 668445. doi: 10.3389/feart.2021.668445
Bollen, K. A., and R. Jackman. 1985. Regression diagnostics: An expository treatment of outliers and influential cases. Sociological Methods and Research 13: 510–542. doi:10.1177/0049124185013004004
Bookstein, F. L. 1991. Morphometric Tools for Landmark Data: Geometry and Biology. New York: Cambridge University Press, Cambridge (UK).
Brook, A. H., M. B. O’Donnell, A. Hone, E. Hart, T. E. Hughes, R. N. Smith, and G. C. Townsend. 2014a. General and craniofacial development are complex adaptive processes influenced by diversity. Australian Dental Journal 59: 13–22. doi:10.1111/adj.12158
Brook, A. H., J. Jernvall, R. N. Smith, T. R. Hughes, and G. C. Townsend. 2014b. The dentition: The outcomes of morphogenesis leading to variations of tooth number, size and shape. Australian Dental Journal 59: 131–142. doi:10.1111/adj.12160
Carter, M., and J. Shieh. 2015. Guide to Research Techniques in Neuroscience, pp. 117–144. Amsterdam, Boston: Elsevier Academic Press. doi:10.1016/B978-0-12-800511-8.00005-8
Dean, D., J. J. Hublin, R. Holloway, and R. Ziegler. 1998. On the phylogenetic position of the pre-Neandertal specimen from Reilingen, Germany. Journal of Human Evolution 34: 485–508. doi:10.1006/jhev.1998.0214
Duval, M., C. Falguères, and J. J. Bahain. 2012. Age of the oldest hominin settlements in Spain: Contribution of the combined U-series/ESR dating method applied to fossil teeth. Quaternary Geochronology 10: 412–417. doi:10.1016/j.quageo.2012.02.025
Edgar, H. J., and S. D. Ousley. 2016. Dominance in dental morphological traits: Implications for biological distance studies. In Biological Distance Analysis: Forensic and Bioarchaeological Perspectives, ed. by M. A. Pilloud and J. T. Hefner, pp. 317–332. Amsterdam, Boston: Elsevier Academic Press. doi:10.1016/B978-0-12-801966-5.00017-2
Elefanti, P., E. Panagopoulou, and P. Karkanas. 2008. The transition from the Middle to the Upper Paleolithic in the Southern Balakans: The evidence from the Lakonis 1 Cave, Greece. Eurasian Prehistory 5: 85–95.
Giusti, D., V. Tourloukis, G. E. Konidaris, N. Thompson, P. Karkanas, E. Panagopoulou, and K. Harvati. 2018. Beyond maps: Patterns of formation processes at the Middle Pleistocene open-air site of Marathousa 1, Megalopolis Basin, Greece. Quaternary International 497: 137–153. doi:10.1016/j.quaint.2018.01.041
Gómez-Robles, A., M. Martinón-Torres, J. M. B. de Castro, L Prado, S. Sarmiento, and J. L. Arsuaga. 2008. Geometric morphometric analysis of the crown morphology of the lower first premolar of hominins, with special attention to Pleistocene Homo. Journal of Human Evolution 55: 627e638.
Gómez-Robles, A., J. M. B. de Castro, M. Martinón-Torres, L. Prado-Simón, and J. L. Arsuaga. 2012. A geometric morphometric analysis of hominin upper second and third molars, with particular emphasis on European Pleistocene populations. Journal of Human Evolution 63: 512-526. doi:10.1016/j.jhevol.2012.06.002
Gunz, P., P. Mitteroecker, F. L. Bookstein. 2005. Semilandmarks in three dimensions. In Modern Morphometrics in Physical Anthropology, ed. by D. E. Slice, pp. 73–98. Boston: Springer. doi:10.1007/0-387-27614-9_3
Green, R. E., J. Krause, A. W. Briggs, T. Maricic, U. Stenzel, M. Kircher, N. Patterson, H. Li, W. Zhai, M. H.-Y. Fritz, et al. 2010. A draft sequence of the Neandertal genome. Science 328:710–722. doi:10.1126/science.1188021
Harvati, K., E. Panagopoulou, and P. Karkanas. 2003. First Neanderthal remains from Greece: The evidence from Lakonis. Journal of Human Evolution 45: 465–473. doi:10.1016/j.jhevol.2003.09.005
Harvati, K., A. Darlas, S. E. Bailey, T. R. Rein, S. El Zaatari, L. Fiorenza, L., O. Kullmer, and E. Psathi. 2013. New Neanderthal remains from Mani Peninsula, Southern Greece: The Kalamakia Middle Paleolithic cave site. Journal of Human Evolution 64: 486–499. doi:10.1016/j.jhevol.2013.02.002
Harvati, K., C. C. Bauer, F. E. Grine, S. Benazzi, R. R. Ackermann, K. L. van Niekerk, and C. S. Henshilwood. 2015. A human deciduous molar from the Middle Stone Age (Howiesons Poort) of Klipdrift Shelter, South Africa. Journal of Human Evolution 82: 190–196. doi:10.1016/j.jhevol.2015.03.001
Harvati, K. 2016. Paleoanthropology in Greece: Recent findings and interpretations. In Paleoanthropology of the Balkans and Anatolia: Human Evolution and Its Context, ed. by K. Harvati and M. Roksandic, pp. 3–14. Dordrecht: Springer. doi:10.1007/978-94-024-0874-4_1
Harvati, K., C. Röding, A. M. Bosman, A. F. Karakostis, R. Grün, C. Stringer, P. Karkanas, N. C. Thompson, V. Koutoulidis, L. A. Moulopoulos, V. G. Gorgoulis, and M. Kouloukoussa. 2019. Apidima Cave fossil provides earliest evidence of Homo sapiens in Eurasia. Nature. doi:10.1038/s41586-019-1376-z
Hublin, J. J..1998. Climatic changes, paleogeography, and the evolution of the Neandertals. In Neandertals and Modern Humans in Western Asia, ed. by T. Akazawa, K. Aoki and O. Bar-Yosef, pp. 295–310. New York: Plenum Press. doi:10.1007/0-306-47153-1_18
Hublin, J. J.. 2009. The origin of Neandertals. Proceedings of the National Academy of Sciences 106: 16022–16027. doi:10.1073/pnas.0904119106
Konidaris, G. E., A. Athanassiou, V. Tourloukis, N. Thompson, D. Giusti, E. Panagopoulou, and K. Harvati. 2018. The skeleton of a straight-tusked elephant (Palaeoloxodon antiquus) and other large mammals from the Middle Pleistocene butchering locality Marathousa 1 (Megalopolis Basin, Greece): Preliminary results. Quaternary International 497: 65–84. doi:10.1016/j.quaint.2017.12.001
Konidaris, G. E., V. Tourloukis, A. Athanassiou, D. Giusti, N. Thompson, E. Panagopoulou, P. Karkanas, and K. Harvati. 2019. Marathousa 2: A new Middle Pleistocene locality in Megalopolis Basin (Greece) with evidence of human modifications on faunal remains. PESHE 8: 82.
Jacobs, Z., B. Li, P. Karkanas, V. Tourloukis, N. Thompson, E. Panagopoulou, and K. Harvati. 2018. Optical dating of K-feldspar grains from Middle Pleistocene lacustrine sediment at Marathousa 1 (Greece). Quaternary International 497: 170–177. doi:10.1016/j.quaint.2018.06.029
Koenigswald, W. V., and W. D. Heinrich. 2007. Biostratigraphische Begriffe aus der Säugetierpaläontologie für das Pliozän und Pleistozän Deutschlands. Eiszeitalter und Gegenwart Quaternary Science Journal 56: 96–115.
Landis, J., and G. Koch. 1977. The measurement of observer agreement for categorical data. Biometrics 33:159–174. doi:10.2307/2529310
Löhnert, E., and H. Nowack. 1965. Die Braunkohlenlagerstätte von Khoremi im Becken von Megalopolis/Peloponnes. Geologisches Jahrbuch 82: 847–868.
Macchiarelli, R., L. Bondioli, and A. Mazurier. 2008. Virtual dentitions: Touching the hidden evidence. In Technique and Application in Dental Anthropology, ed. by J. D. Irish and G. C. Nelson, Cambridge Studies in Biological and Evolutionary Anthropology 53, pp. 426–448. Cambridge: Cambridge University Press. doi:10.1017/CBO9780511542442.018
Macho, G. A., and J. Moggi-Cecchi. 1992. Reduction of maxillary molars in Homo sapiens sapiens: a different perspective. American Journal of Physical Anthropology 87: 151e159.
Marinos, G. 1975. Über einen menschlichen Zahn unter den Säugetier-Resten biharischen Alters von Megalopolis. Annales Géologiques des Pays Helléniques 27: 64–65.
Martinón-Torres, M., M. Bastir, J. M. B. de Castro, A. Gómez, S. Sarmiento, A. Muela, J. L. Arsuaga. 2006. Hominin lower second premolar morphology: Evolutionary inferences through geometric morphometric analysis. Journal of Human Evolution 50: 523e533.
Melentis, J. K. 1961. Die Dentition der Pleistozänen Proboscidier des Beckens von Megalopolis im Peloponnes (Griechenland). Annales Géologiques des Pays Helléniques 12: 153–262.
Neubauer, S., P. Gunz, and J. J. Hublin. 2009. The pattern of endocranial ontogenetic shape changes in Humans. Journal of Anatomy 215: 240–255. doi:10.1111/j.1469-7580.2009.01106.x
Okuda, M., N. van Vugt, T. Nakagawa, M. Ikeya, A. Hayashida, Y. Yasuda, and T. Setoguchi. 2002. Palynological evidence for the astronomical origin of lignite–detritus sequence in the Middle Pleistocene Marathousa member, Megalopolis, SW Greece. Earth and Planetary Science Letters 201: 143–157. doi:10.1016/S0012-821X(02)00706-9
Papagopoulou, E., V. Tourloukis, N. Thompson, A. Athanassiou, G. Tsartsidou, G. E. Konidaris, D. Giusti, P. Karkanas, and K. Harvati. 2015. Marathousa 1: A new Middle Pleistocene archaeological site from Greece. Antiquity 89: Project Gallery. doi:10.15496/publikation-5878
Pitsios, T. K. 1999. Paleoanthropological research at the cave site of Apidima and the surrounding region (South Peloponnese, Greece). Anthropologischer Anzeiger 57: 1–11.
Posth, C., C. Weißling, K. Kitagawa, L. Pagani, L. Van Holstein, F. Racimo, N. J. Conard, C. J. Kind, H. Bocherens, and J. Krause. 2017. Deeply divergent archaic mitochondrial genome provides lower time boundary for African gene flow into Neanderthals. Nature Communications 8: 16046. doi:10.1038/ncomms16046
R Development Core Team. 2011. R: A language and Environment for Statistical Computing. R Foundation for Statistical Computing, Vienna, Austria. ISBN 3-900051-07-0.
Sankararaman, S., N. Patterson, H. Li, S. Pääbo, D. Reich. 2012. The date of interbreeding between Neanderthals and modern humans. PLOS Genetics 8: e1002947. doi:10.1371/journal.pgen.1002947
Schneider, T., K. Filo, A. L. Kruse, M. Locher, K. W. Grätz, and H. T. Lübbers. 2014. Variations in the anatomical positioning of impacted mandibular wisdom teeth and their practical implications. Swiss Dental Journal 124: 520-538.
Scott, G., C. Turner II, G. Townsend, G., and M. Martinón-Torres. 2018. The Anthropology of Modern Human Teeth: Dental Morphology and its Variation in Recent and Fossil Homo sapiens. Cambridge Studies in Biological and Evolutionary Anthropology 79. Cambridge: Cambridge University Press. doi:10.1017/9781316795859
Singleton, M. 2002. Patterns of cranial shape variation in the Papionini (Primates: Cercopithecinae). Journal of Human Evolution 42:547–578. doi:10.1006/jhev.2001.0539
Sickenberg, O. 1976. Eine Säugetierfauna des tieferen Bihariums aus dem Becken von Megalopolis (Peloponnes, Griechenland). Annales Géologiques des Pays Helléniques 27: 25–63.
Siavalas, G., M. Linou, A. Chatziapostolou, S. Kalaitzidis, H. Papaefthymiou, and K. Christanis. 2009. Palaeoenvironment of Seam I in the marathousa lignite mine, Megalopolis Basin (Southern Greece). International Journal of Coal Geology 78: 233–248. doi:10.1016/j.coal.2009.03.003
Skouphos, T. G. 1905. Über die palaeontologischen Ausgrabungen in Griechenland in Beziehung auf das Vorhandensein des Menschen. In Comptes Rendus du Congrès International d’Archéologie, pp. 231–236. Athènes.
Smith, P., J. S. Brink, J. W. Hoffman, L. C. Bam, R. Nshimirimana, and F.C. de Beer. 2015. The late Middle Pleistocene upper third molar from Florisbad: Metrics and morphology. Transactions of the Royal Society of South Africa 70: 233–244. doi:10.1080/0035919X.2015.1065930
Sprowls, M. W., R. E. Ward, P. L. Jamison, and J. K. Hartsfield. 2008. Dental arch asymmetry, fluctuating dental asymmetry, and dental crowding: A comparison of tooth position and tooth size between antimeres. Seminars in Orthodontics 14: 157–165. doi:10.1053/j.sodo.2008.02.006
Thompson, N., V. Tourloukis, E. Panagopoulou, and K. Harvati. 2018. In search of Pleistocene remains at the gates of Europe: Directed surface survey of the Megalopolis Basin (Greece). Quaternary international 497: 22–32. doi:10.1016/j.quaint.2018.03.036
Tourloukis, V., N. Thompson, C. Garefalakis, P. Karkanas, G. E. Konidaris, E. Panagopoulou, and K. Harvati. 2016. New Middle Palaeolithic sites from the Mani Peninsula, Southern Greece. Journal of Field Archaeology 41: 68–83. doi:10.1080/00934690.2015.1125223
Tourloukis, V., N. Thompson, E. Panagopoulou, D. Giusti, G. E. Konidaris, P. Karkanas, and K. Harvati. 2018a. Lithic artifacts and bone tools from the Lower Palaeolithic Site Marathousa 1, Megalopolis, Greece: Preliminary results. Quaternary International 497: 47–64. doi:org/10.1016/j.quaint.2018.05.043
Tourloukis, V., G. Muttoni, P. Karkanas, E. Monesi, G. Scardia, E. Panagopoulou, and K. Harvati. 2018b. Magnetostratigraphic and chronostratigraphic constraints on the Marathousa 1 Lower Palaeolithic site and the Middle Pleistocene deposits of the Megalopolis Basin, Greece. Quaternary International 497: 154–169. doi:10.1016/j.quaint.2018.03.043
Tourloukis, V., and K. Harvati. 2018. The Palaeolithic record of Greece: A synthesis of the evidence and a research agenda for the future. Quaternary International 466: 48–65. doi:10.1016/j.quaint.2017.04.020
White, S., J. A. J. Gowlett, and M. Grove. 2014. The place of the Neanderthals in hominin phylogeny. Journal of Anthropological Archaeology 35: 32–50.
Wood, B., S. A. Abbott, and S. H. Graham. 1983. Analysis of the dental morphology of Plio-Pleistocene hominids II: Mandibular molars – study of cusp areas, fissure pattern and cross sectional shape of the crown. Journal of Anatomy 137: 287e314.
Van Vugt, N., H. de Bruijn, T. van Kolfschoten, and C. G. Langereis. 2000. Magneto- and cyclostratigraphy and mammal-fauna’s of the Pleistocene lacustrine Megalopolis Basin, Peloponnesos, Greece. Geological Ultrajectina 189: 69–92.
Vargiu, R., A. Cucina, and A. Coppa. 2009. Italian populations during the Copper Age: Assessment of biological affinities through morphological dental traits. Human Biology 81: 479–494. doi:10.3378/027.081.0406
Venables, W. N., and B. D. Ripley. 2002. Modern Applied Statistics with S. 4th edition. New York: Springer. doi:10.1007/978-0-387-21706-2
Vinken, R. 1965. Stratigraphie und Tektonik des Beckens von Megalopolis (Peloponnes, Griechenland). Geologisches Jahrbuch 83: 97-148.
von Cramon-Taubadel, N., B. C. Franzier, and M. Marizón Lahr. 2007. The problem of assessing landmark error in geometric morphometrics: Theory, methods, and modifications. American Journal of Physical Anthropology 134: 24–35. doi:10.1002/ajpa.20616
Wandsnider, L. 2004. Solving the puzzle of the archaeological labyrinth: Time perspectivism in Mediterranean surface archaeology. In Side-by-Side Survey: Comparative Regional Studies in the Mediterranean World, ed. by S. Alcock and J. F. Cherry, pp. 49–62. Anthropology Faculty Publications 75. Oxford: Oxbow Press.
Xing, S., M. Martinón-Torres, J. M. B. de Castro, Y. Zhang, X. Fan, L. Zheng, W. Huang, and W. Liu. 2014. Middle Pleistocene hominin teeth from Longtan Cave, Hexian, China. PloS one 9: e114265. doi:10.1371/journal.pone.0114265
Xirotiris, N., W. Henke, and N. Symeonidis. 1979. Der M3 von Megalopolis – ein Beitrag zu seiner Morphologischen Kennzeichnung. Zeitschrift für Morphologie und Anthropologie 70: 117–122.
Zanolli, C. 2013. Additional evidence for morpho-dimensional tooth crown variation in a new Indonesian H. erectus sample from the Sangiran Dome (Central Java). PLoS ONE 8: e67233. doi:10.1371/journal.pone.0067233
Zanolli, C. 2015. Molar Crown Inner Structural Organization in Javanese Homo erectus. American Journal of Physical Anthropology 156: 148–157. doi:10.1002/ajpa.22611
Zelditch, M., D. Swiderski, and H. Sheets. 2012. Geometric Morphometrics for Biologists: A Primer. 2nd Edition. San Diego: Elsevier Academic Press.