Abstract
This study sets out to consider the influence of geographical scale on the association between molecular genetic differentiation and craniometric phenotypic differentiation in recent human populations. We employ interpopulation distance measurements for three different anatomical regions of the skull and for three different systems of genetic markers in 30 Eurasian populations. Our original dataset comprises 703 male skulls measured for 21 mid-facial, 15 neurocranial and 6 mandibular measurements, in all cases assessing Mahalanobis distances between populations. Published genetic data of more than 2,000 individuals were summarized by between-population FST based on allele frequencies of autosomal single nucleotide polymorphisms (SNPs), as well as Cavalli-Sforza distances based on the frequencies of 19 Y-chromosome and 29 mtDNA haplogroups. For different geographical scales of analysis, we used Mantel tests to assess the association of craniometric and genetic inter-population distances for the different cranial regions and genetic markers. Our results show that the level of association between craniometric and genetic distances depends on the part of the skull quantified and on the set of variables employed. In our dataset, this association is much stronger for the mid-face than for the cranial vault. Furthermore, the Mantel test correlation coefficients for the broadest, intercontinental level of analysis are moderate to high, and some are among the highest published so far. They are consistently lower at smaller geographic levels of comparison. Autosomal SNP distances exhibit the strongest associations with cranial morphology for almost all anatomical regions and at all geographical levels. Our results are evaluated against the background of previous studies assessing the correlation between craniometric, genetic, and geographic distances, drawing attention to the need for investing much more effort in studying factors affecting the association between genetic and craniometric distances at regional and local geographical levels.
Introduction
During the last two decades, molecular genetic data have been extensively used to validate the role of craniometric variables as a reliable source of information for reconstructing human population history (Roseman 2004; Harvati and Weaver 2006a; von Cramon-Taubadel 2009a; Evteev and Movsesian 2016; Reyes-Centeno et al. 2017, among others). This endeavor follows a decades-long debate on the evolutionary mechanisms affecting cranial form, particularly the degree of environmental and hereditary effects on cranial dimensions (Boas 1912, 1940; Sparks and Jantz 2002; Relethford 2004b, among others). On theoretical grounds, both biological data sources are expected to reflect the natural history of human populations (Relethford and Harpending 1994). For modern humans, this has been empirically supported by the observation that both molecular genetic diversity and cranial phenotypic diversity within modern human populations decreases from Africa, the continental geographic region of origin in the deep past (e.g., Relethford 2004a; reviewed in Reyes-Centeno 2016). In addition, genetic and cranial diversity between populations, i.e., biological distance, increases as a function of geographical separation between populations, i.e., geographical distance (Ramachandran 2005; Betti et. al. 2010). Methodologically, the approach for validating the utility of craniometric variables is therefore often based on the use of genetic distance data as a “gold standard,” where it is employed as a benchmark for establishing the degree of biological variation between human populations. In general, it is thought that the higher the degree of association between craniometric and genetic distances is, the better the former reflects the biological relationship between human populations. In this chapter, we concentrate on this methodological approach for validating the utility of craniometric variables in reconstructing the human past.
Early heuristic studies comparing genetic and craniometric distances at the global level were optimistic in reporting moderate to high correlations between the two types of data (Relethford 2004a; Roseman 2004; Gonzalez-Jose et al. 2004; Harvati and Weaver 2006a, 2006b), which comprised both linear and three-dimensional morphometric variables as well as functional and non-functional regions of the genome. However, a bulk of subsequent studies has shown that the strength of the association between craniometric and genetic distances depends on a number of factors, including the part of the skull studied, morphometric technique applied, system of genetic markers employed and, importantly, on the geographical scale of comparison, i.e., global (intercontinental), continental, or local (Harvati and Weaver 2006a, b; Smith et al. 2007; Smith 2009; von Cramon-Taubadel 2009a, 2009b, 2011a, 2011b, 2016; Ricaut et al. 2010; Reyes-Centeno et al. 2014, 2015, 2017; Herrera et al. 2014; von Cramon-Taubadel and Lycett 2014; Smith et al. 2016; Evteev and Movsesian 2016; Evteev et al. 2017; Moiseyev, de la Fuente 2017). For example, whereas some studies select parts of the skull with respect to hypotheses on skeletal integration and modularity (e.g., von Cramon-Taubadel 2011), others sample skull regions with respect to hypotheses on their phylogenetic utility (e.g., Harvati and Weaver 2006a, 2006b; Smith 2009; von Cramon-Taubadel 2009). In fact, because of distinct research designs, a wide range of statistical association between phenotypic and genetic variation has also been demonstrated in earlier works using anthropometric traits and genetic markers (Hiernaux 1956; Sanghvi 1956; Friedlander et al. 1971; Rothhammer and Spielman 1972; Spielman 1973; Neel et al. 1974; see also Relethford and Lees 1982 and Jorde 1980 for excellent reviews of previous literature). The relative effect of the study design factors listed above remains to be systematically tested since the great majority of recent studies were carried out at the global level and most of these employ only one system of molecular genetic markers.
The question of which anatomical region of the cranium reflects population history best has been a matter of great interest. It is generally agreed that a) the mandible displays the lowest correlations and, within the cranium, b) the temporal bone performs slightly better, probably due to its mostly chondrocranial embryonic origin (Harvati and Weaver 2006a; Nicholson and Harvati 2006; Smith 2009; Reyes-Centeno et al. 2017). However, results of different studies are not directly comparable due to the lack of uniformity in their research designs. It is also unclear if the trends observed at the global (intercontinental) level are applicable to a lower level of population differentiation, i.e., continental or sub-continental. This study therefore sets out to explore to what degree (i) the selection of craniometric and genomic markers, on the one hand, and (ii) the geographic scale of analysis, on the other, affect the association between genetic differentiation and craniometric interpopulation distances across North Eurasia. We employ measurements of three anatomical regions of the skull and three systems of genetic markers, as well as geographic distances across three geographic analytical scales. Importantly, the vast geographical space of North Eurasia has been underrepresented in previous craniometric-genetic association studies and the present work is thus intended to fill this gap. The results obtained for the study’s dataset are evaluated against a background of a large number of correlation coefficients between craniometric, genetic, and geographic distances in the literature. Finally, we discuss the implications of our study in the context of a broader debate on the evolution of cranial form in modern humans.
Materials & methods
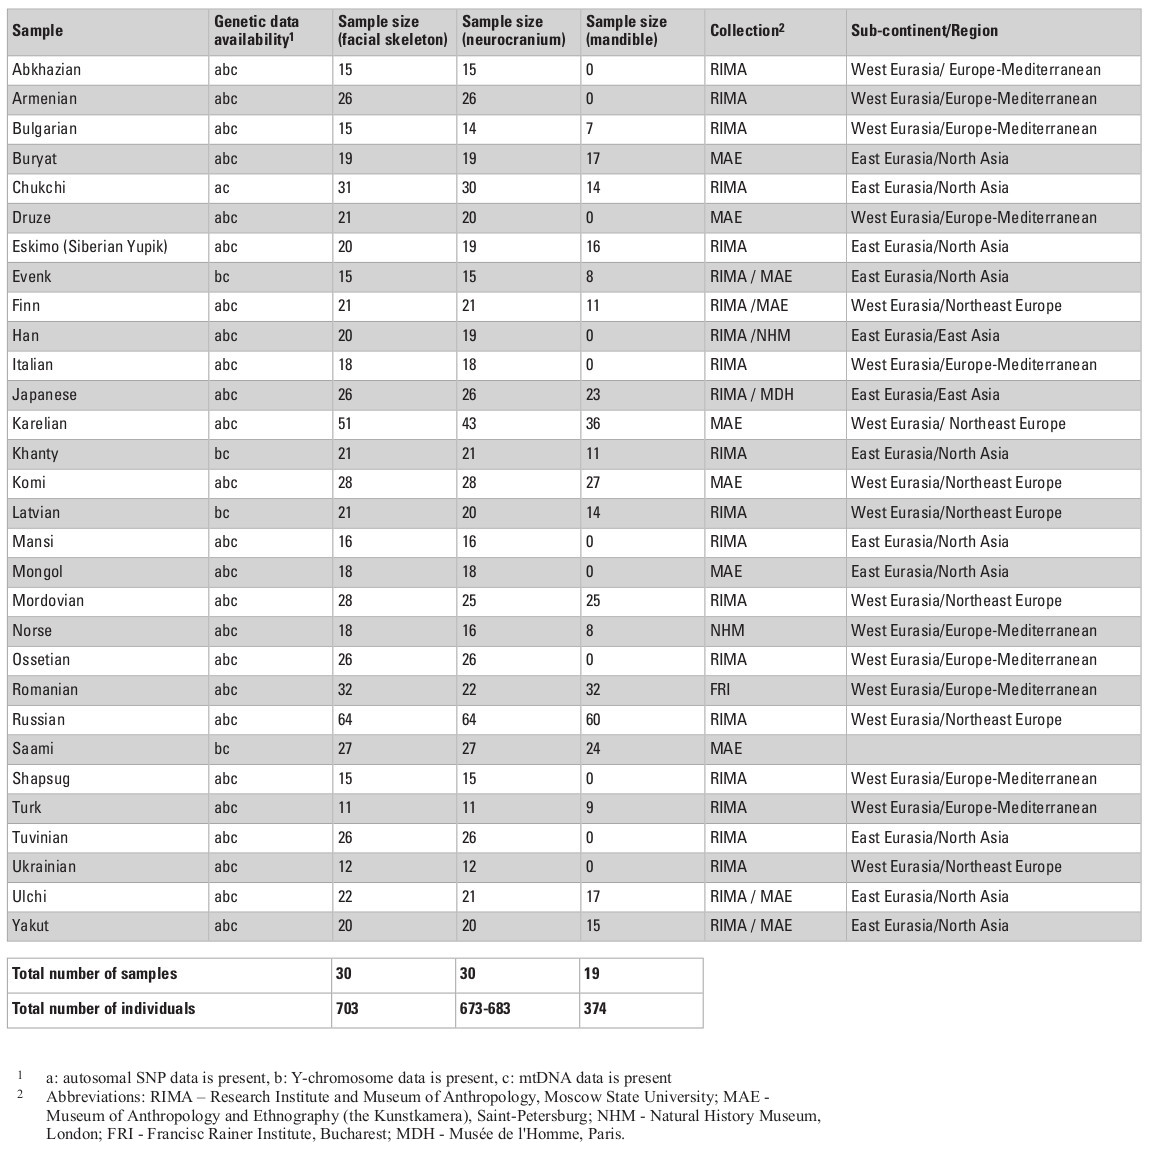
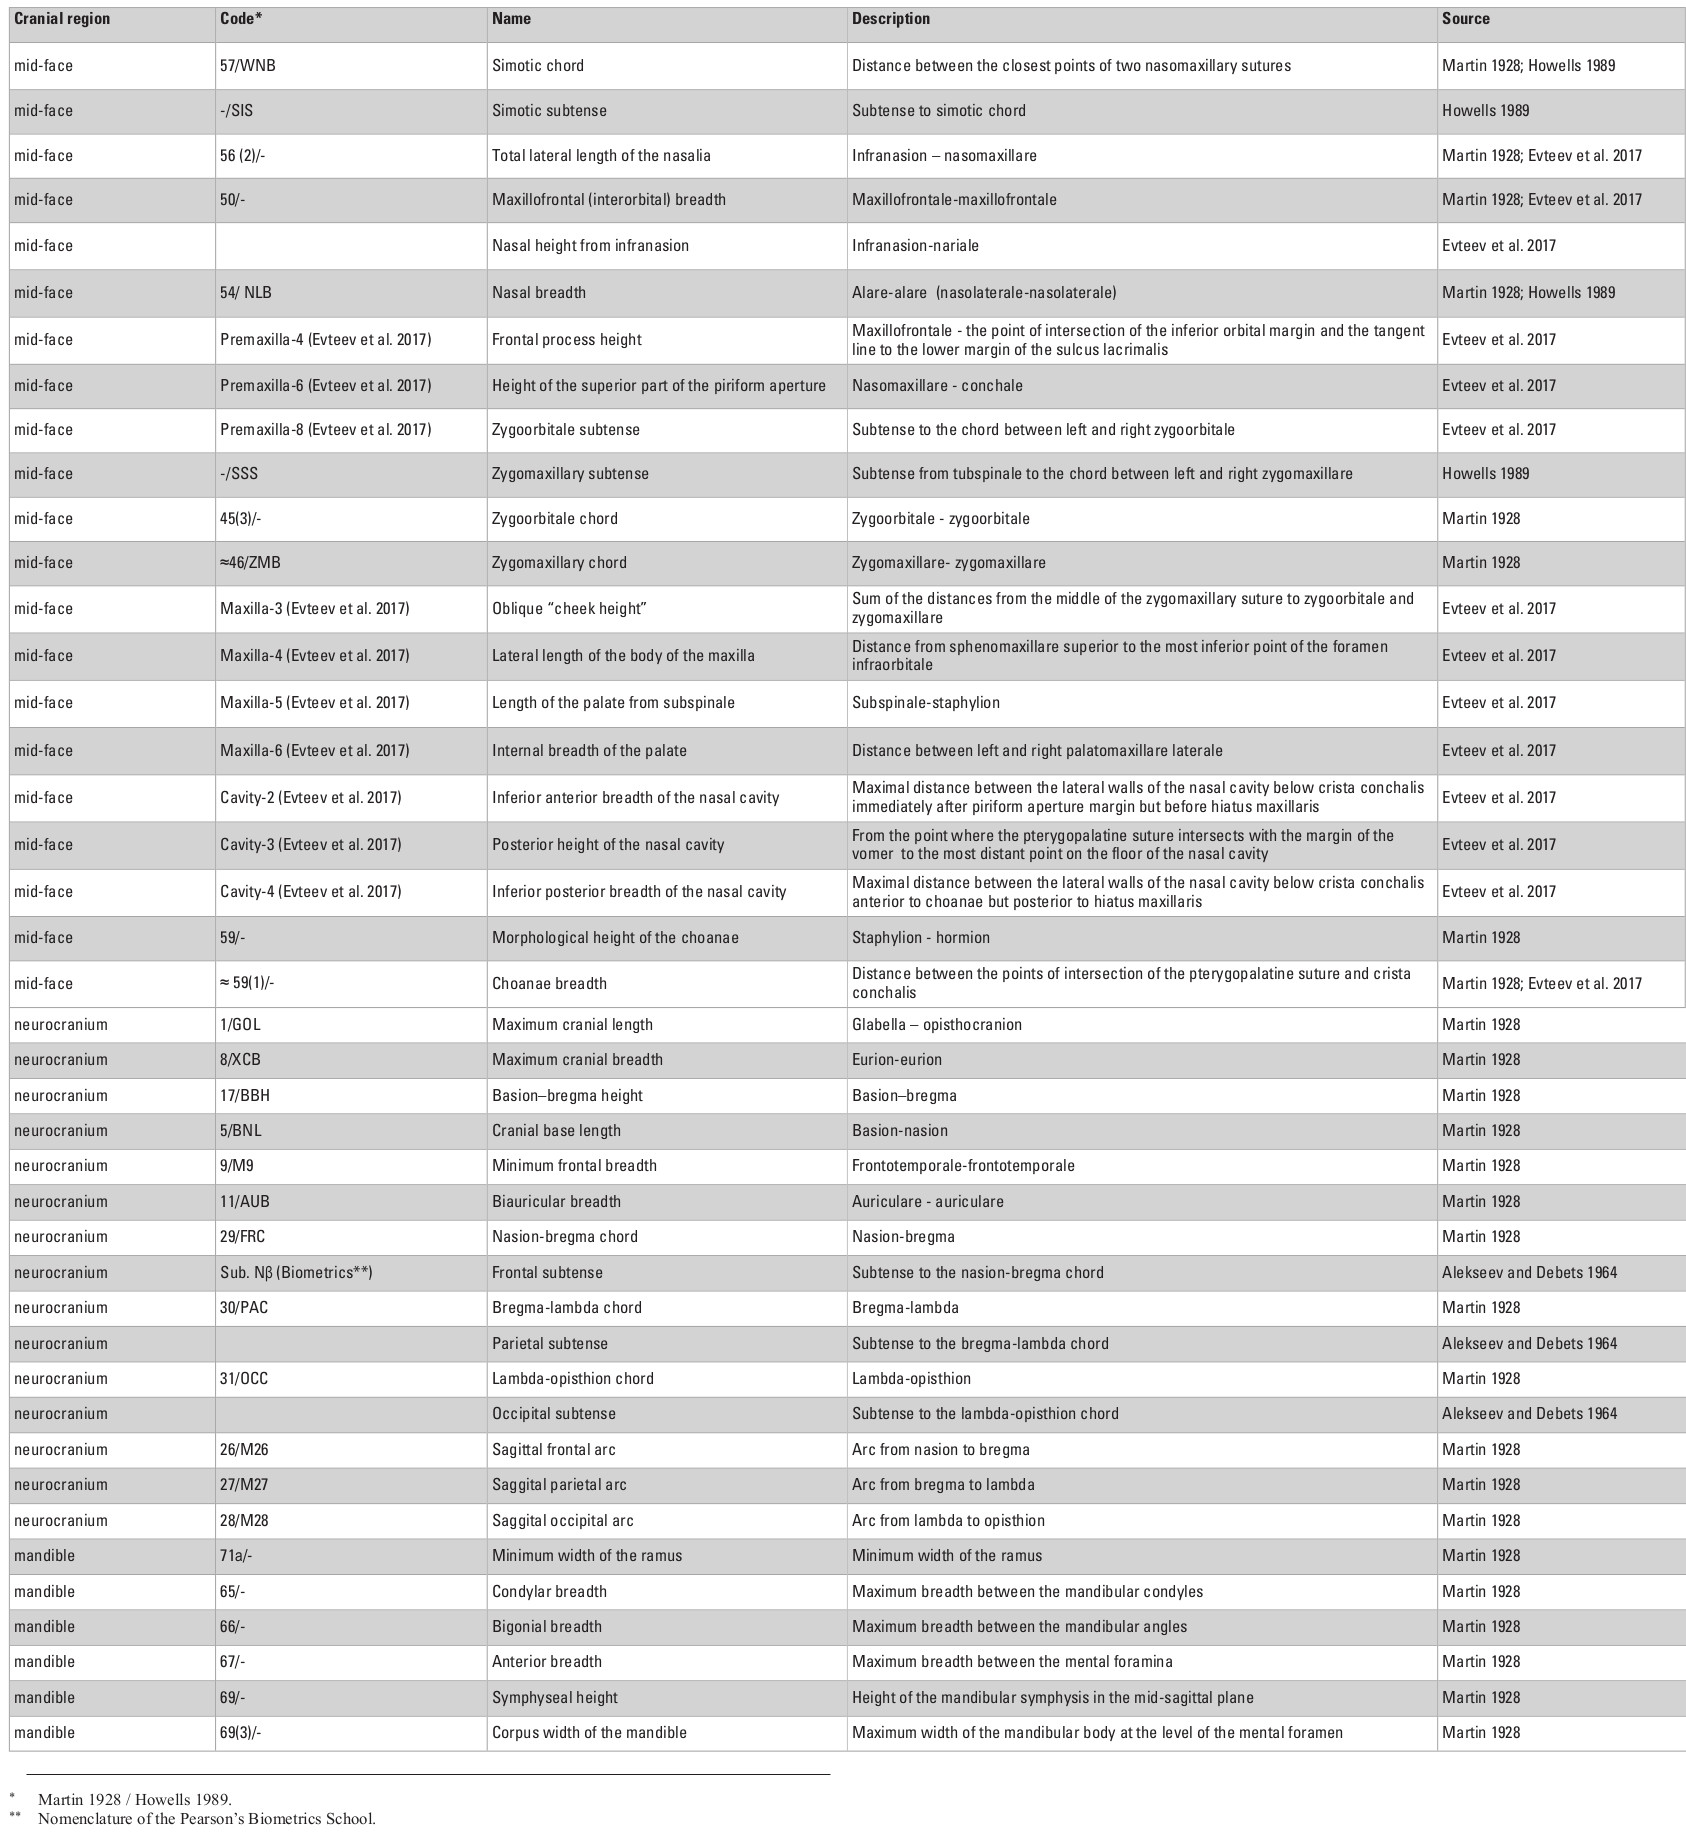
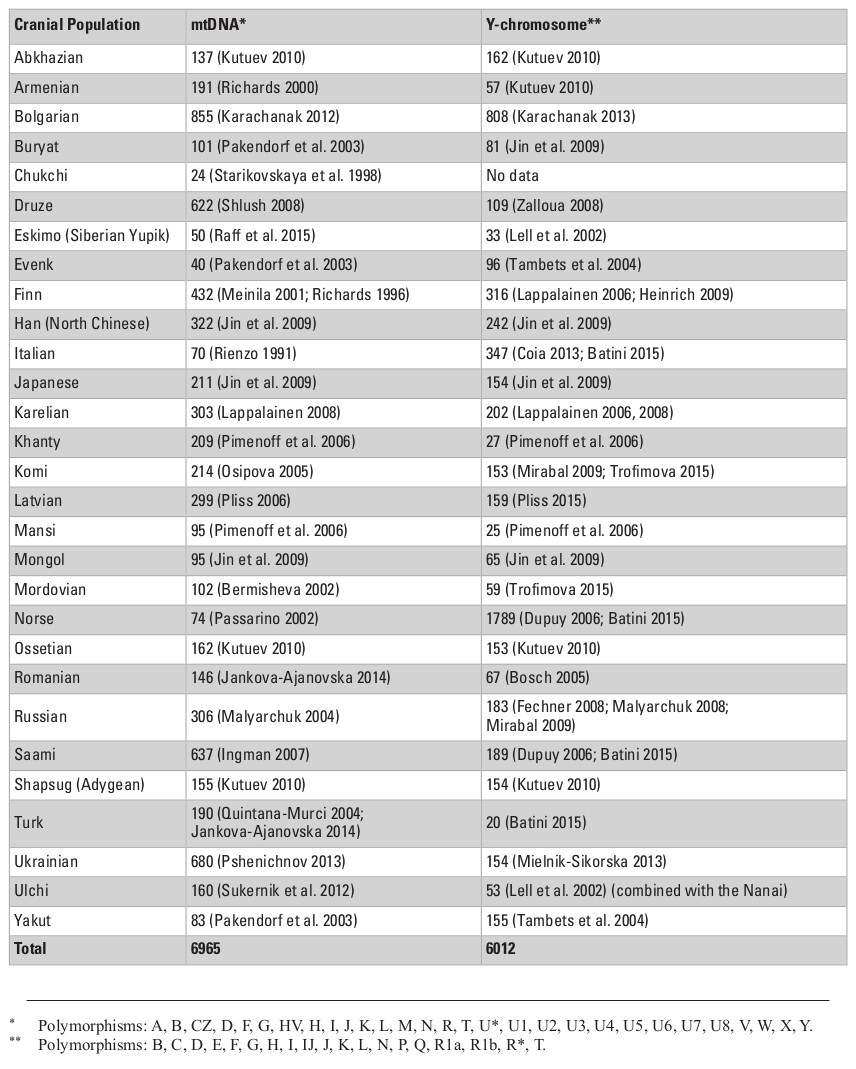
The cranial sample employed in this study consists of 703 male skulls from 30 Eurasian populations (Table 1) measured by one of the authors (AE; see Evteev et al. 2014 for the intraobserver error test) using a set of standard calipers according to a protocol including 21 mid-facial, 15 neurocranial and 6 mandibular measurements (see Appendix, Table S1, at the end of this chapter). Missing data were imputed by mean substitution with respect to each population, except in cases where an entire cranial region was missing. For example, mandibles were present only in some of the samples (see Table 1 for details of sample sizes). Raw cranial measurements used in this study are available on request. Matrices of Mahalanobis distances were calculated for every set of groups/variables separately for every particular analysis. Each analysis was conducted once using the raw craniometric variables and again using size-standardized variables, calculated by dividing each measurement by the geometric mean of all measurements, per individual (Darroch and Mosimann 1985).
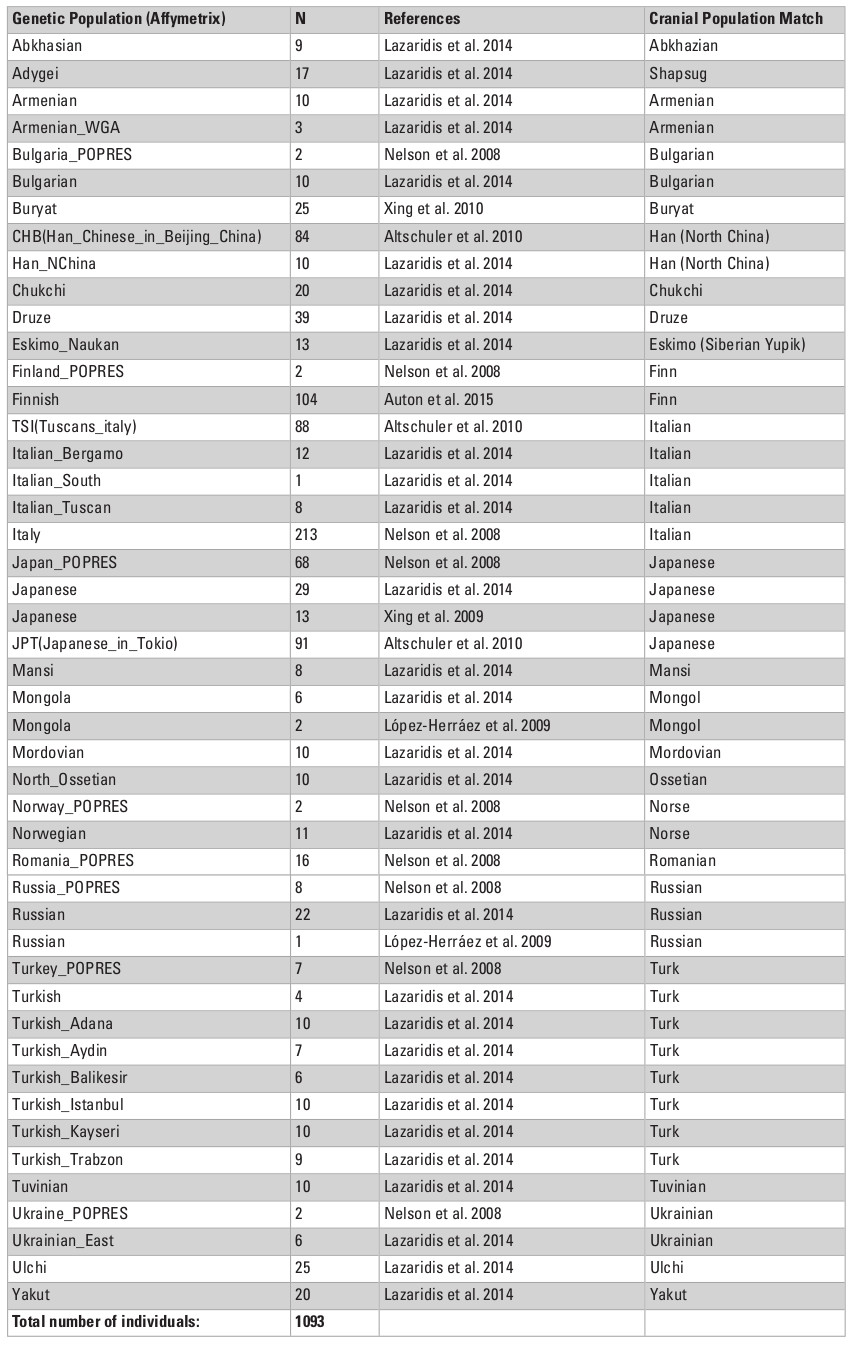
Cranial samples were matched with molecular genetic data based on ethno-linguistic affinities and geographical origin. In total, we analyzed genetic data for three types of loci: autosomal single nucleotide polymorphisms (SNPs), mitochondrial DNA (mtDNA), and Y-chromosome DNA. First, the autosomal data were collected from two SNP chip array sources for published data of 26 Eurasian populations, comprising 1450 individuals in total (Tables S2, S3, Appendix). Data for the Adygeans were used for the Shapsugi cranial sample. Genetic variation between populations for SNP allele frequencies was calculated by between-population FST (Weir and Cockerham 1984) using the software 4P (Benazzo et al. 2015). Inter-population FST measures have been found to be highly correlated with Mahalanobis distances for craniometric variables (Reyes-Centeno et al. 2017). Second, we used haplogroup frequencies for the Y-chromosome and mtDNA data (Evteev et al. 2017), compiled from numerous studies (Table S4, Appendix) carried out using very divergent methodological approaches and styles of publishing of raw material (full mitochondrial genomes, or HVSI and II sequences, or frequencies of haplogroups). Thus, the only possible way of compiling these into a single dataset was to employ haplogroup frequencies. The Y-chromosome data for the Ulchi include samples of the Nanai. In total, we used frequencies of 19 Y-chromosome haplogroups and 29 mtDNA haplo-groups to calculate Cavalli-Sforza distances (Cavalli-Sforza and Edwards 1967) for each system of genetic markers. In all cases, we compiled distance matrices representing inter-population genetic variation for the different genetic markers (Tables S6–S9, Supplementry online material). Table 1 lists details of the availability of different types of genetic markers for different cranial population samples. In most cases, all three molecular data types could be compiled.
Geographic distances between centroids of origin of all populations (Tables S10–S11, Supplementary online material) were calculated as great-circle distances (using the Haversine formula in: http://www.movable-type.co.uk/scripts/latlong.html), ignoring possible water and mountain barriers. In order to compare our results to previous studies, the strength of association between the matrices of craniometric, genetic, and geographic distances was assessed using Mantel tests (Smouse and Sokal 1986). These were carried out in PAST (Hammer et al. 2011) by setting the similarity measure as “User distance” universally for all matrices and testing for significance via 9999 permutations of the matrix values. Results are reported as Pearson r correlation values with one-tailed p significance values. In addition, we employed Dow-Cheverud tests (Dow and Cheverud 1985) to assess which of the subsets of the variables was statistically more associated with genomic markers in comparison to other cranial subsets. Dow-Cheverud tests were conducted in R using a script coded by M. W. Grabowski and C. C. Roseman.
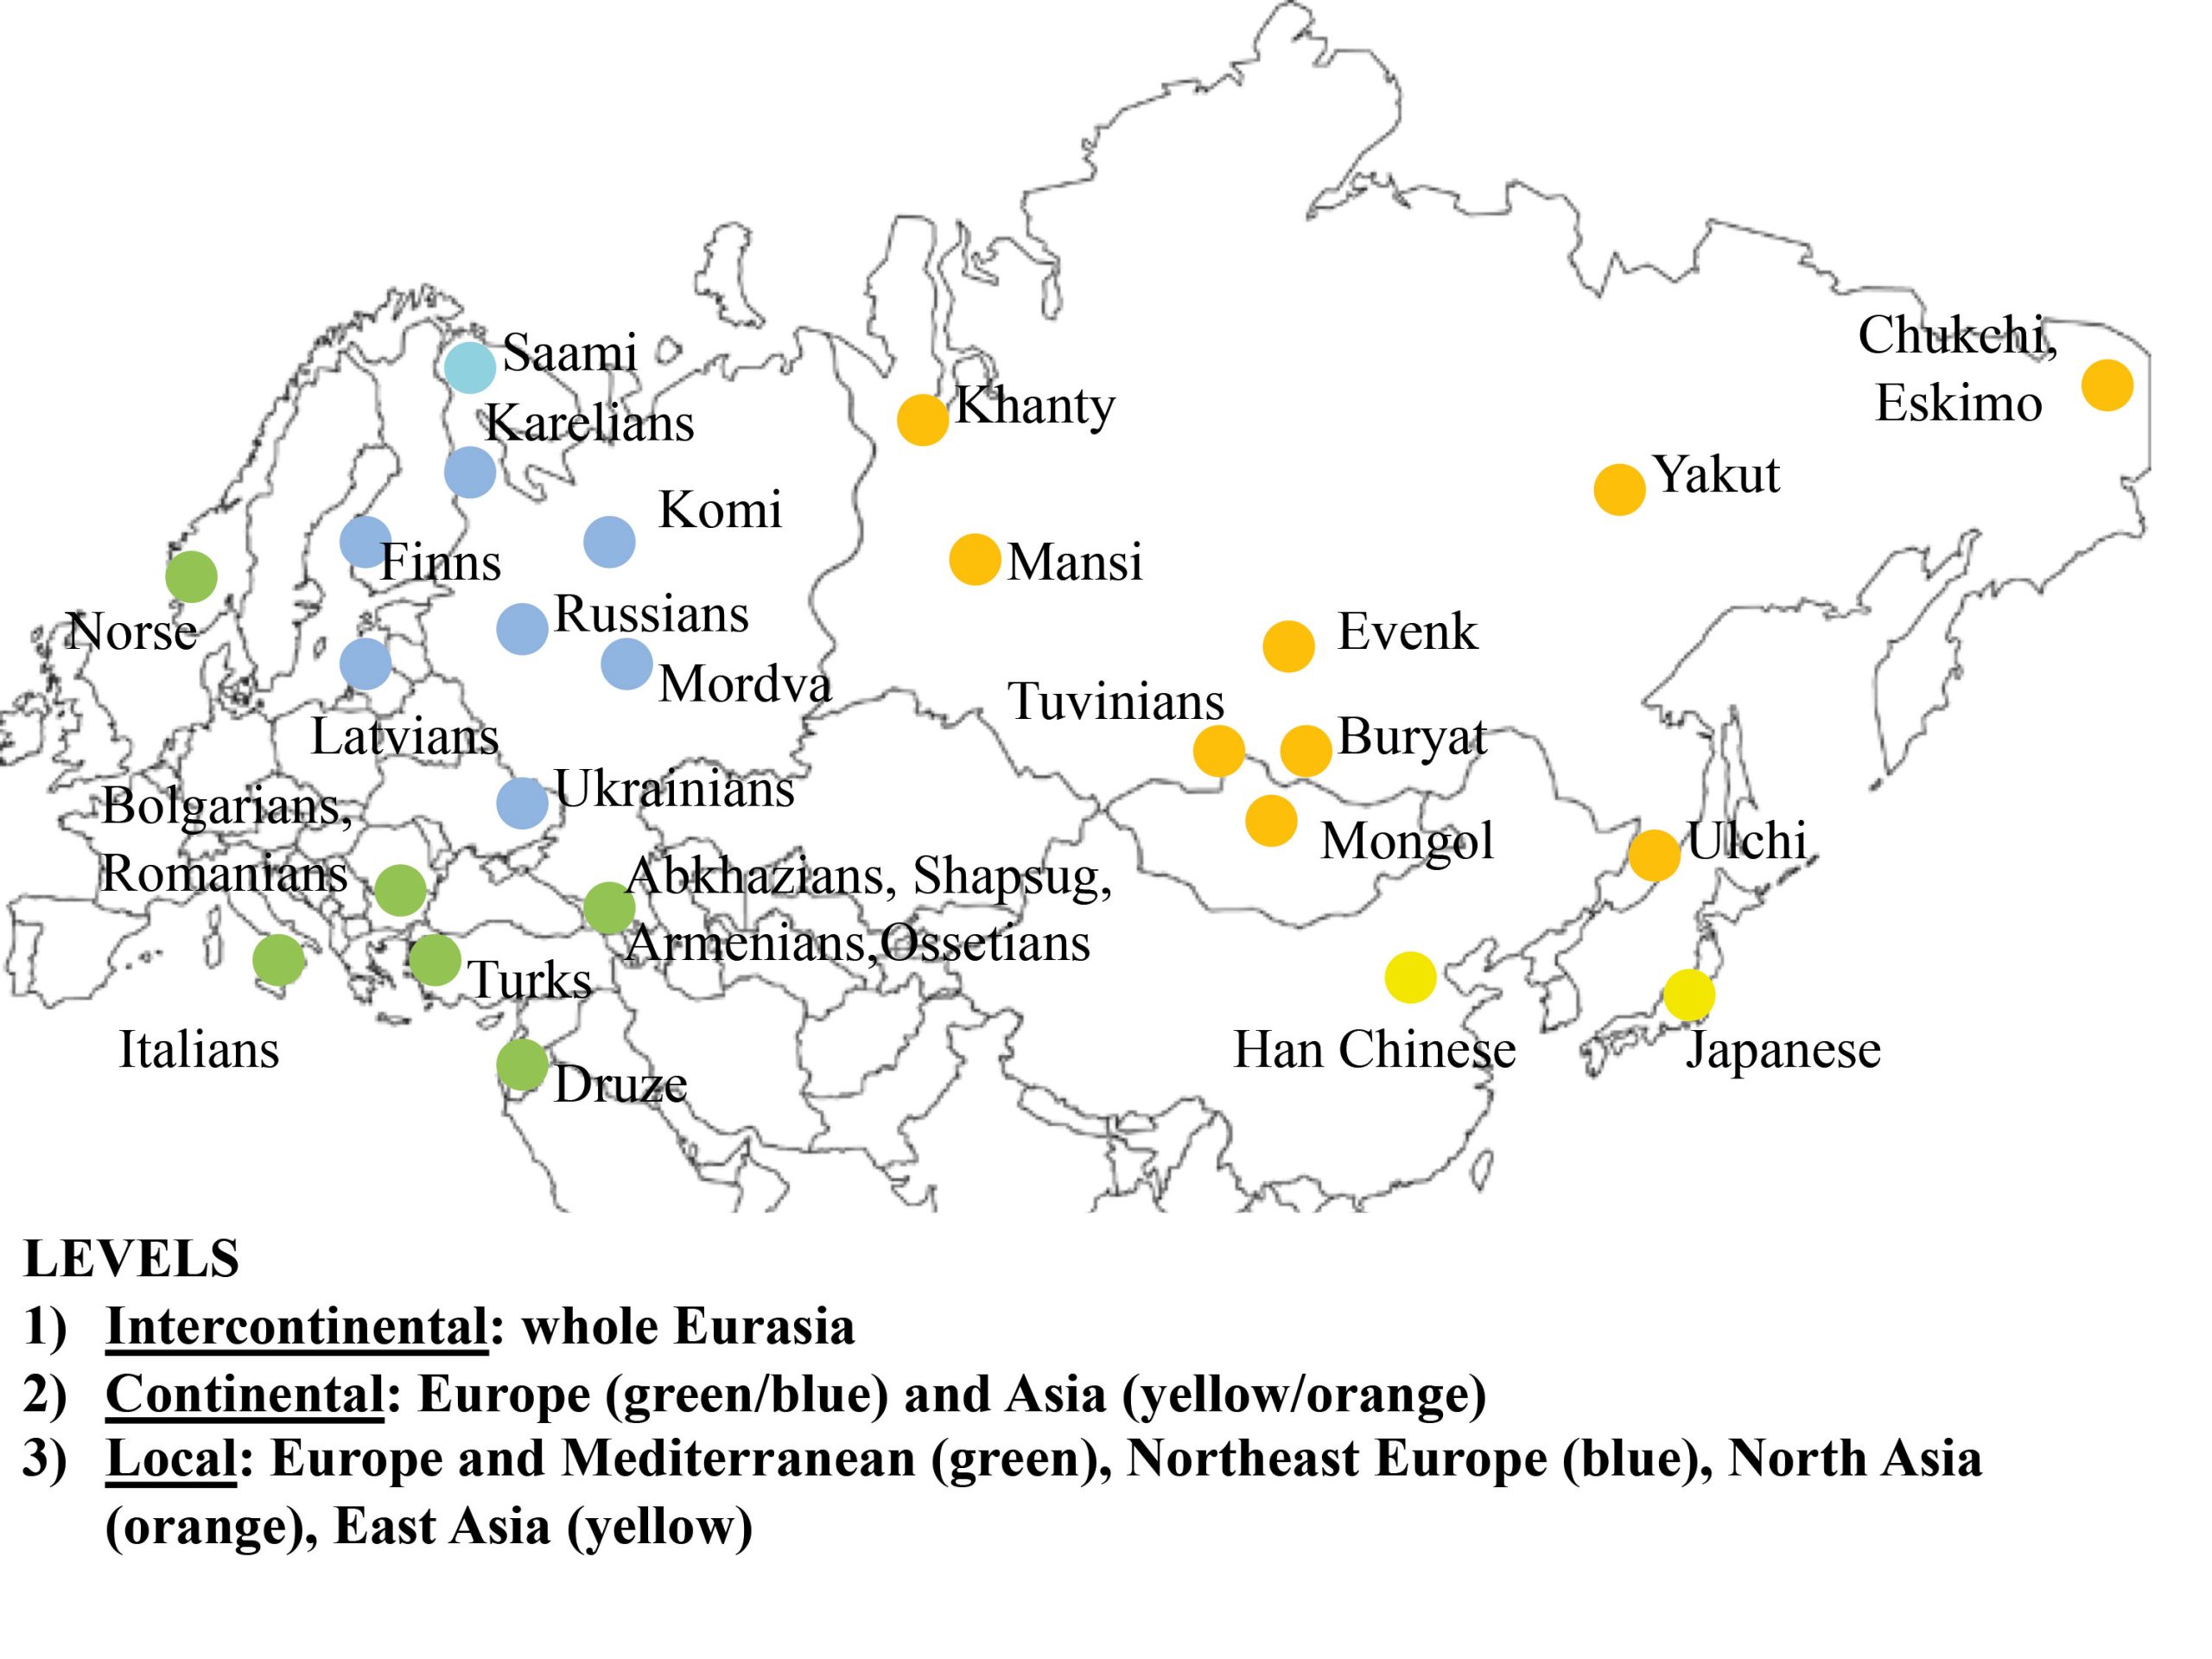
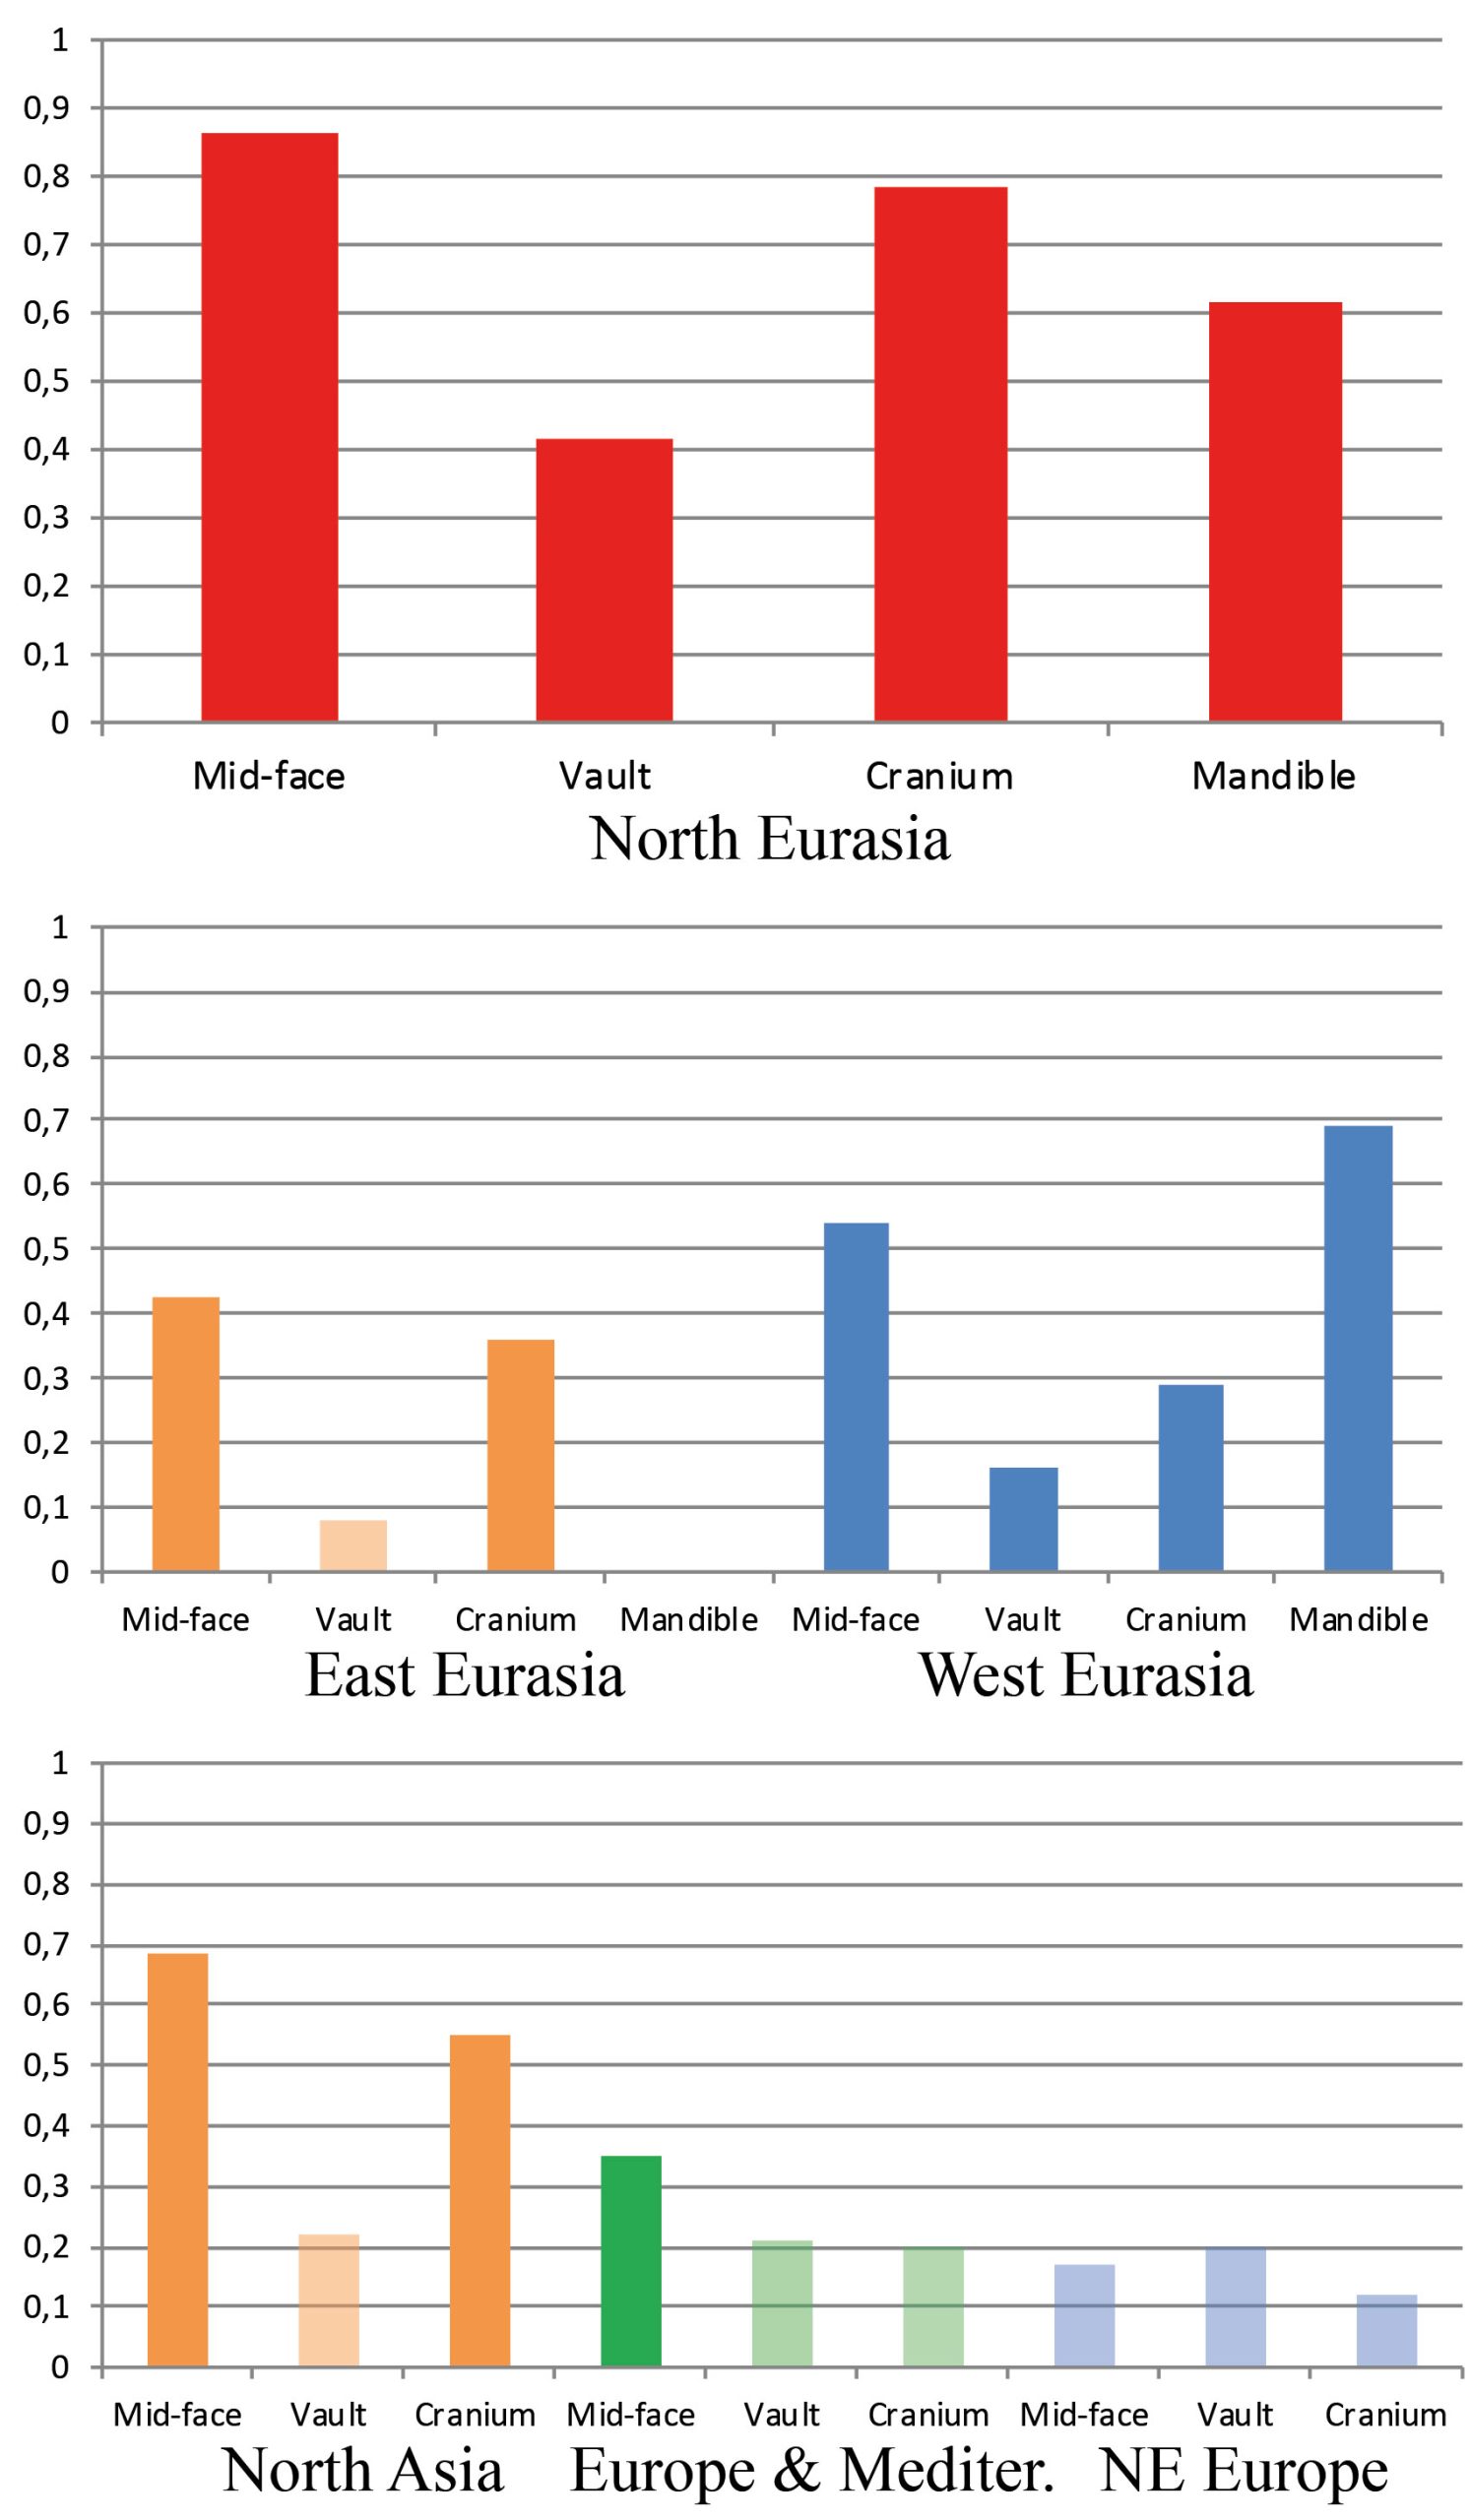
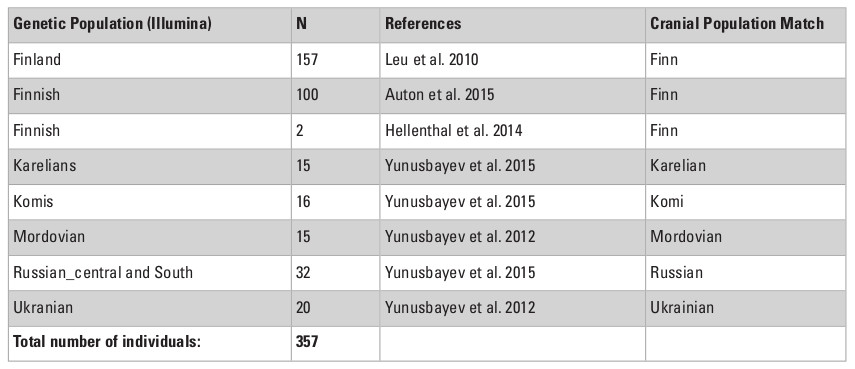
In order to test the role of the geographical level of comparison (see Fig. 1), we used three areal divisions: intercontinental, continental, and local. First, the main dataset (30 populations, intercontinental level) was divided into two subsets: “West Eurasia” (17 populations, continental level) and “East Eurasia” (12 populations, continental level). These two are based on the separation of Europe and Asia as distinct continents and corresponds with analytical sub-divisions of previous morphological and genetic studies (e.g., Howells 1989; Hanihara 2000; Reich et al. 2012; Fu et al. 2013). As the origin and degree of admixture in the Saami is not completely clear (see Tambets et al. 2004), this population was not included in any of the two subsets. The latter were further divided into two parts each according to the previously shown ecogeographic differences across those geographical levels (Evteev et al. 2014, 2017). The West Eurasian set was divided into a “Europe-Mediterranean” subset (10 populations, local level), including populations from South and West Europe, the Mediterranean, and the Caucasus, as well as into a “Northeast Europe” (7 populations, local level) subset. The East Eurasian set was divided into “North Asia” (10 populations, local level) and “East Asia” (2 populations, local level). The justification for such a division was the climate-morphology associations demonstrated in previous studies (Evteev et al. 2014, 2017) and separating the populations into presumably cold-adapted and non-cold-adapted. For instance, the Norse were included in the “Europe-Mediterranean” subset because, despite formally representing North Europe, they did not display a particularly strong climatic signal in their craniofacial morphology. Since only two populations were included in the “East Asia” subset, this level was not analyzed further. In total, 6 geographical scales and 3 hierarchical geographic levels of population differentiation were considered. The Karelian sample was excluded from the Mantel tests involving mtDNA matrices in the “West Eurasia” and “North Europe” datasets since it was identified as a genetic outlier. In most analyses, samples genotyped through the Affymetrix array (referred as Affymetrix dataset hereafter) comprising 50786 autosomal SNPs were employed. However, analysis of the Northeast Europe level employed data from the Illumina array (Illumina dataset hereafter), which comprised 114109 markers from 6 populations. The inclusion of both the Affymetrix and Illumina datasets for this particular level increased the number of population samples available for analysis (Tables S2, S3, Appendix). The two datasets provide very similar patterns of interpopulation distances (Mantel Pearson correlation: r = 0.98, two-tailed p = 0.04 after 1000 permutations) and were thus used interchangeably.
In order to test how the level of genetic or morphological differentiation within a geographical scale affects our Mantel test results, we evaluated the association between the mean Mantel correlation coefficients (Table 1) within a region and either mean autosomal FST or mean Mahalanobis distances (mid-face) within a region, quantified with the Spearman rank correlation coefficient (r).
In order to compare our results to previous analyses, a database containing about two hundred correlation coefficients between craniometric and anthropometric, as well as genetic distances in humans and nonhuman primates, published to date was compiled (Table S12, Supplementary online material). Ninety-six of these coefficients, calculated for worldwide (or intercontinental) modern human cranial samples using Mantel tests (Gonzalez-Jose et al. 2004; Roseman 2004; Harvati and Weaver 2006a, 2006b; Smith et al. 2007; Smith 2009; von Cramon-Taubadel 2009a, 2009b, 2011a, 2011b, 2016; Reyes-Centeno et al. 2017; Smith et al. 2016), were selected to be employed as source of comparison for our results.
A similar database containing more than eighty correlation coefficients between craniometric (anthropometric) and geographic distances, as well as latitude and longitude, in humans was also compiled (Table S13, Supplementary online material). Twenty eight of these coefficients were calculated for worldwide (or intercontinental) modern human cranial samples and geographic distances using Mantel tests (Relethford 2004b; Gonzalez-Jose et al. 2001; Smith et al. 2007; Hubbe et al. 2009, 2010, 2011; Betti et al. 2010; von Cramon-Taubadel 2011b, 2016; Noback and Harvati 2015; Reyes-Centeno et al. 2015) were selected to be compared with our results alongside with six coefficients (Rothhammer and Silva 1990; Lalueza Fox et al. 1996; Fabra and Demarchi 2011; Maley 2011; Weisensee 2013; Hubbe et al. 2014) for samples at lower geographic levels (continental, inter-continental, or local).
Results
Associations at the intercontinental (North Eurasian) level
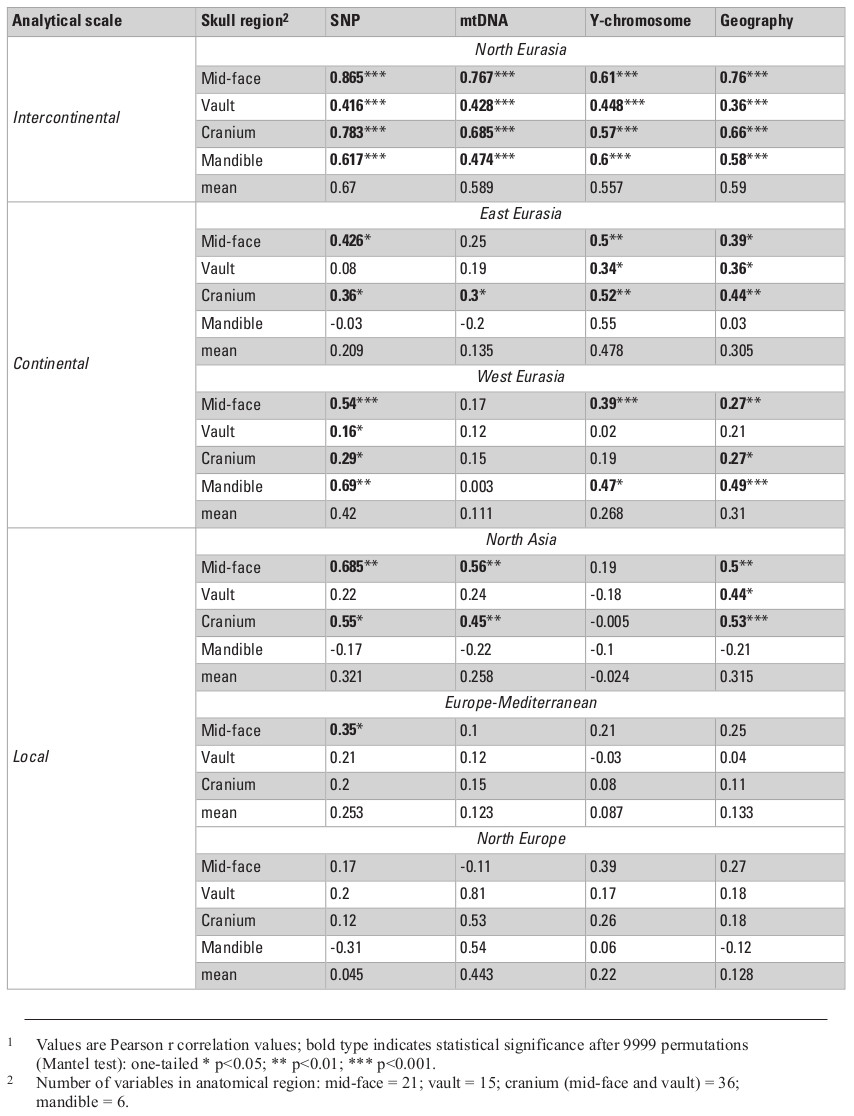
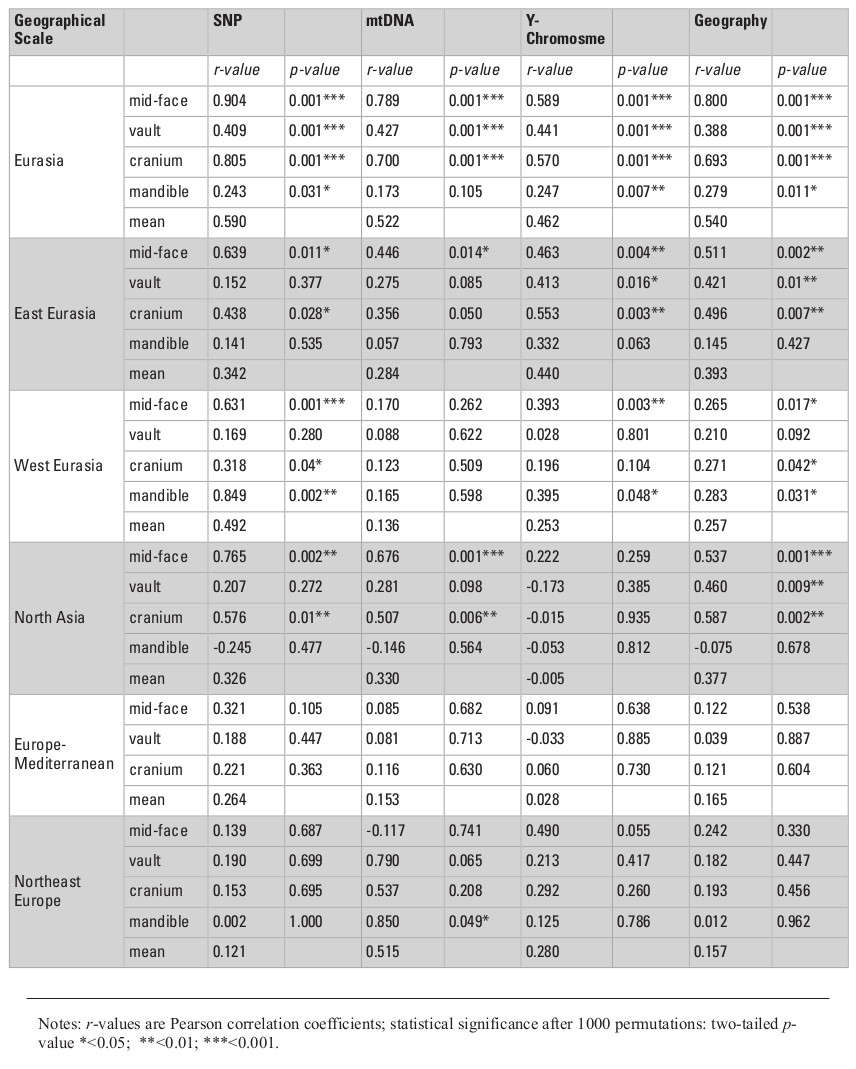
Table 2 presents the results of all matrix correlations calculated for different cranial anatomical regions, genetic markers, and geographic distances across the different analytical scales and using the raw dataset. Results are similar when using size-standardized craniometric variables (Table S5, Appendix). All the coefficients at the intercontinental level are moderate to high (Fig. 2). But the strength of the association is clearly different between different systems of genetic markers and different anatomical regions (see Figs. 2 and 3). Correlations with the autosomal SNP data demonstrate the strongest associations, while they are weakest for the Y-chromosome data. Considering the lower levels of population differentiation, the autosomal SNP matrices are consistently more associated with the craniometric distance matrices at all levels while the uniparental markers display various patterns (Table 2; Figs. 5 and 6). The facial skeleton is the part of the cranium exhibiting the highest correlations with genetic distances in all the geographical scales studied (Table 2; Figs. 3, 5 and 6). The mandible displays on average higher coefficients compared to the vault. However, due to small sample sizes, the results for this bone are typically not statistically significant. Within the cranium subsets, the mid-face was significantly more associated with genomic distances than the vault at the highest, intercontintental scale (Dow-Cheverud r = 0.512, p = <0.001).
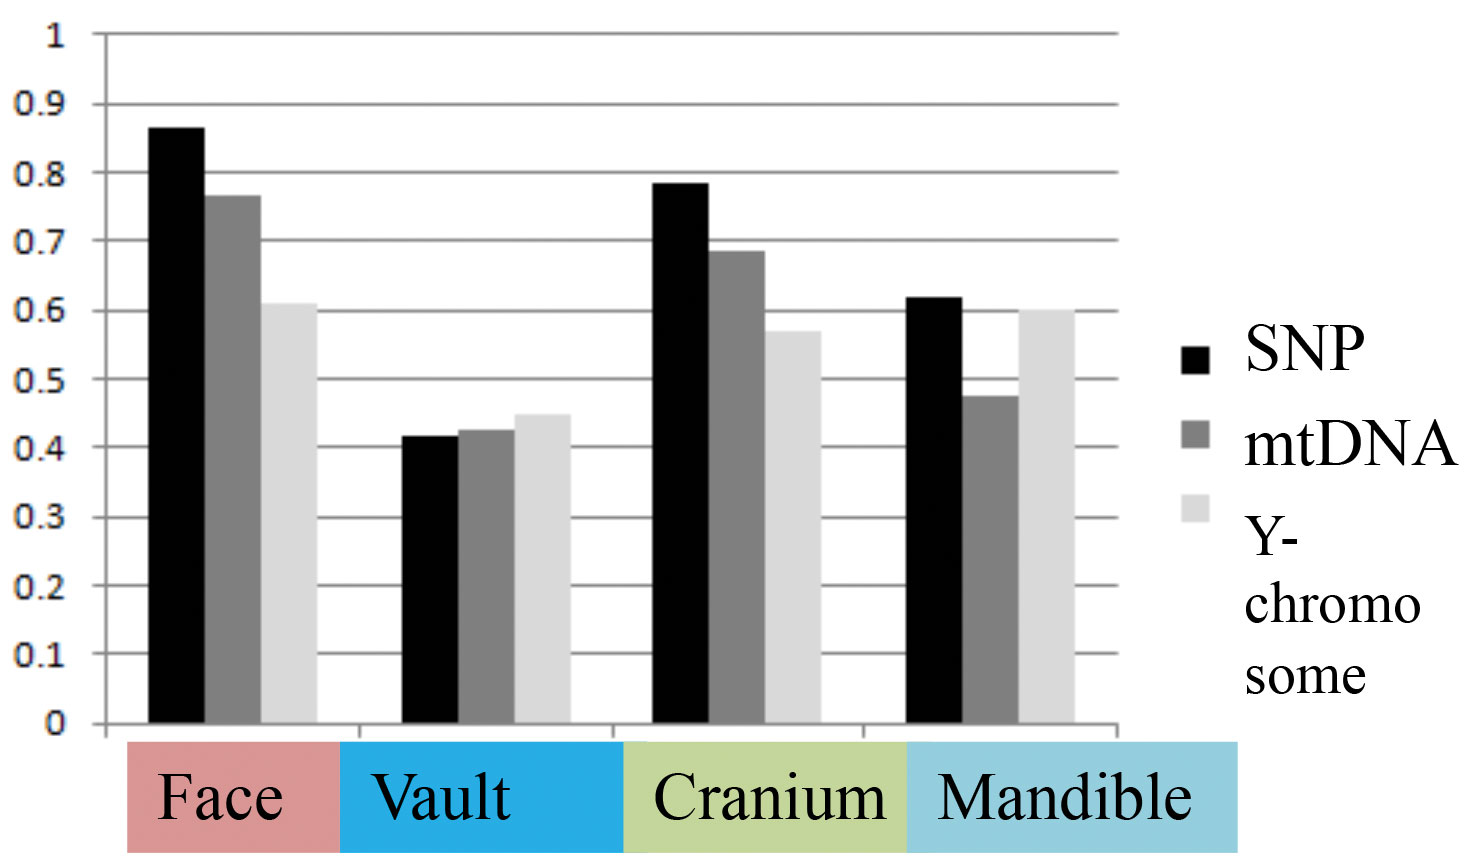
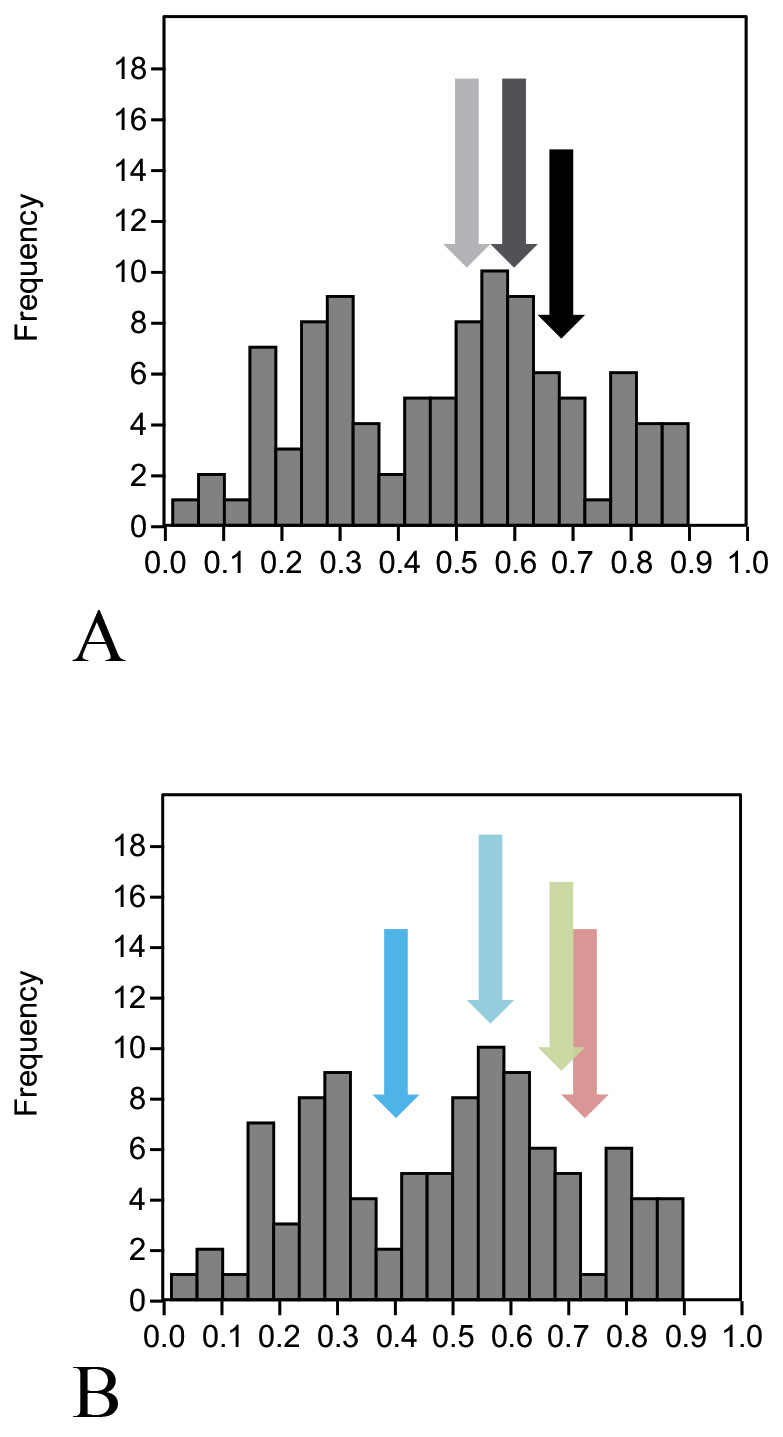
A) Different systems of genetic markers (arrows: SNP – black, mtDNA dark grey, Y-chromosome – light grey); B) Different skull anatomical regions (arrows: face – pink, cranium – green, mandible – light blue, vault – deep blue).
Study design factors affecting the association between craniometric and genetic distances at worldwide and intercontinental levels
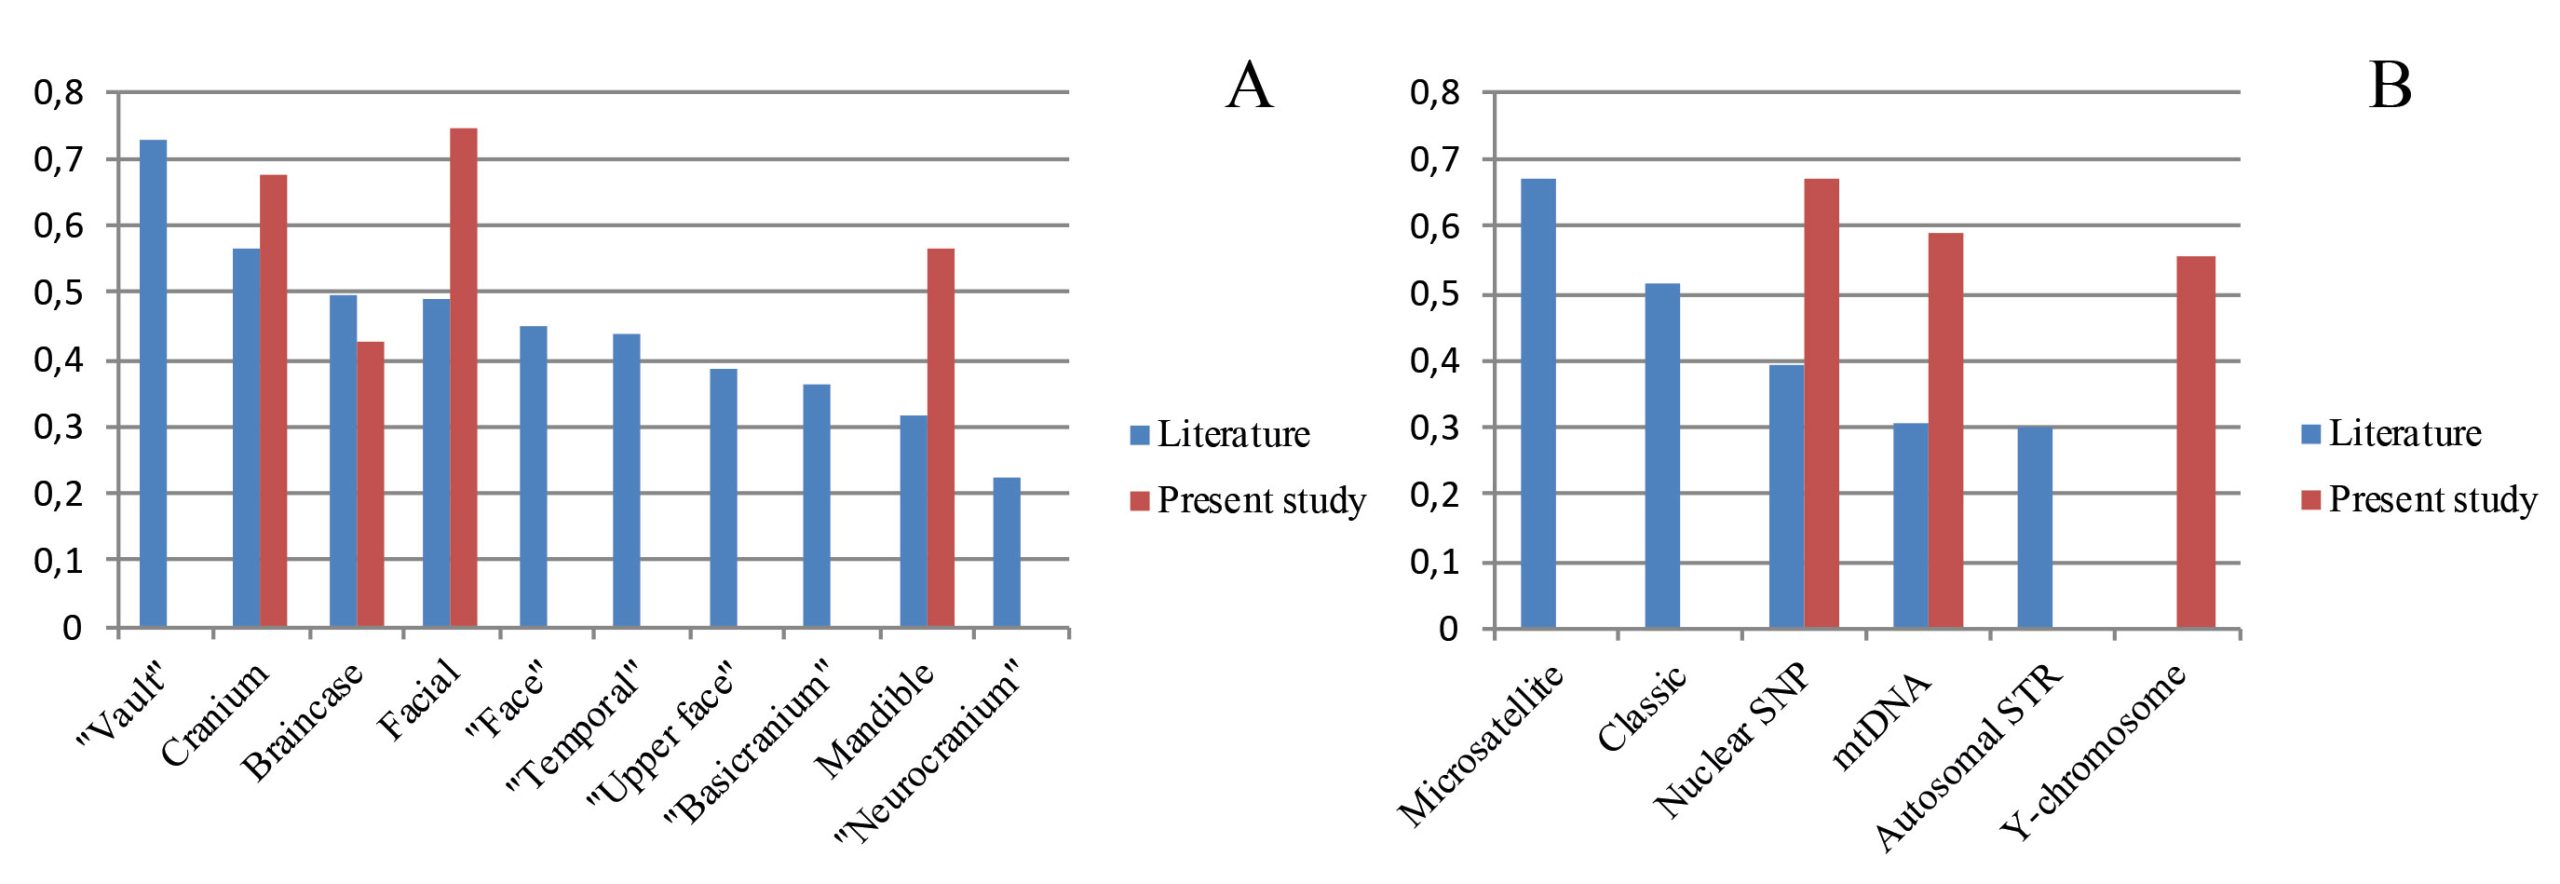
Based on our systematic literature review, we found that almost all correlation coefficients published previously (Table S12, Supplementary online material) which can be directly compared with those obtained in the present study were undertaken using worldwide or intercontinental cranial samples, employing geometric morphometric techniques and Mantel tests. Thus, only these geographic levels are considered in this section. However, several systems of genetic markers were used in previous studies and a variety of approaches to sampling of cranial variables were employed. The anatomical regions defined by different authors are numerous and differ with regard to their study design, using, for example, functional anatomical regions or developmental modules. The aggregated categories “braincase,” “face,” “cranium” and “mandible” are analyzed further. The single anatomical regions for which at least five coefficients were published by at least two authors were considered separately and include the following categories: “basicranium,” “neurocranium,” “temporal,” “vault,” “face” and “upper face.” The genetic marker systems employed in the literature include: autosomal short-tandem repeats (i.e., STRs or microsatellites), mtDNA from coding regions, “classic” polymorphisms such as blood group or protein markers, and autosomal SNPs.
The mean coefficients for different cranial regions and genetic marker systems in the reviewed literature are presented in Fig. 4a and 4b, respectively, with the inclusion of our original results. An exceptionally high mean was obtained for the vault and, surprisingly, the lowest coefficients were for the neurocranium, which is practically synonymous to the vault. The means of other anatomical regions vary in a relatively narrow range from r = 0.31 (mandible) to r = 0.56 (cranium). Generalized anatomical regions—cranium, braincase and facial—display slightly higher mean coefficients compared to the others, including the temporal bone and the basicranium, that are argued to contain more phylogenetic information (Lockwood et al. 2004; Harvati and Weaver 2006b; von Cramon-Taubadel 2009a; Reyes-Centeno et al. 2017). The coefficients for the cranium and braincase obtained in the present study for North Eurasia are very close to the means of respective cranial regions while the coefficients for the facial skeleton and mandible are substantially higher than average (Fig. 4a). An interesting picture is observed for the means of the genetic marker systems (Fig. 4b). For instance, coefficients for the same sets of STRs can vary widely, likely because of a difference in cranial sample composition between different studies: compare STR-I and STR-II (Fig. 4b). The coefficients obtained in the present study for all three systems are about as high as the mean for previous studies using microsatellites. Notably, “classic” (i.e., serological) and uniparental markers at the worldwide level do not perform substantially worse than high-throughput nuclear markers.
Geographic distances
The mean correlation coefficients between geographic and craniometric distances for the four cranial anatomical regions obtained in the present study is almost as high as the means for the autosomal genetic distances (i.e., r = 0.59 and r = 0.67, respectively; Table 2). It is also substantially higher than the mean (r = 0.41) of the 28 coefficients published previously (Table S13, Supplementary online material). The mean calculated across the five lower geographic levels and three cranial anatomical regions (except the mandible), r = 0.3, is slightly less than the value for the six analyses of continental, regional, or local levels found in the literature (r = 0.44). Importantly, our results show strong associations between geographical distances and the autosomal FST for some regions (North Eurasia – 0.95; East Eurasia – 0.83; North Asia – 0.82; Northeast Europe – 0.78) but not others (West Eurasia – 0.57; Europe-Mediterranean – 0.66).
Associations at the continental and local levels
In general, a substantial drop in the strength of association between the cranial metrics, on the one hand, and genetic markers or geography, on the other hand, is observed in the continental data subsets compared to the full North Eurasia (intercontinental) dataset (Table 2; Figs. 5 and 6). The same pattern is observed in the sub-continental levels compared to the continental ones, with the exception of North Asia, where correlation values in some cases increase. As evidenced in the summary of results in Table 2, autosomal SNP distances display the highest correlations with craniometric distances compared to other systems of genetic markers. Likewise, the mid-facial set of measurements consistently displays the highest correlations with genetic distances. Therefore, the two following aspects are considered below in more detail: the association of the mid-facial craniometric distances with various genetic and geographic distances (Fig. 5), and the association of autosomal SNP distances with various craniometric distances (Fig. 6).
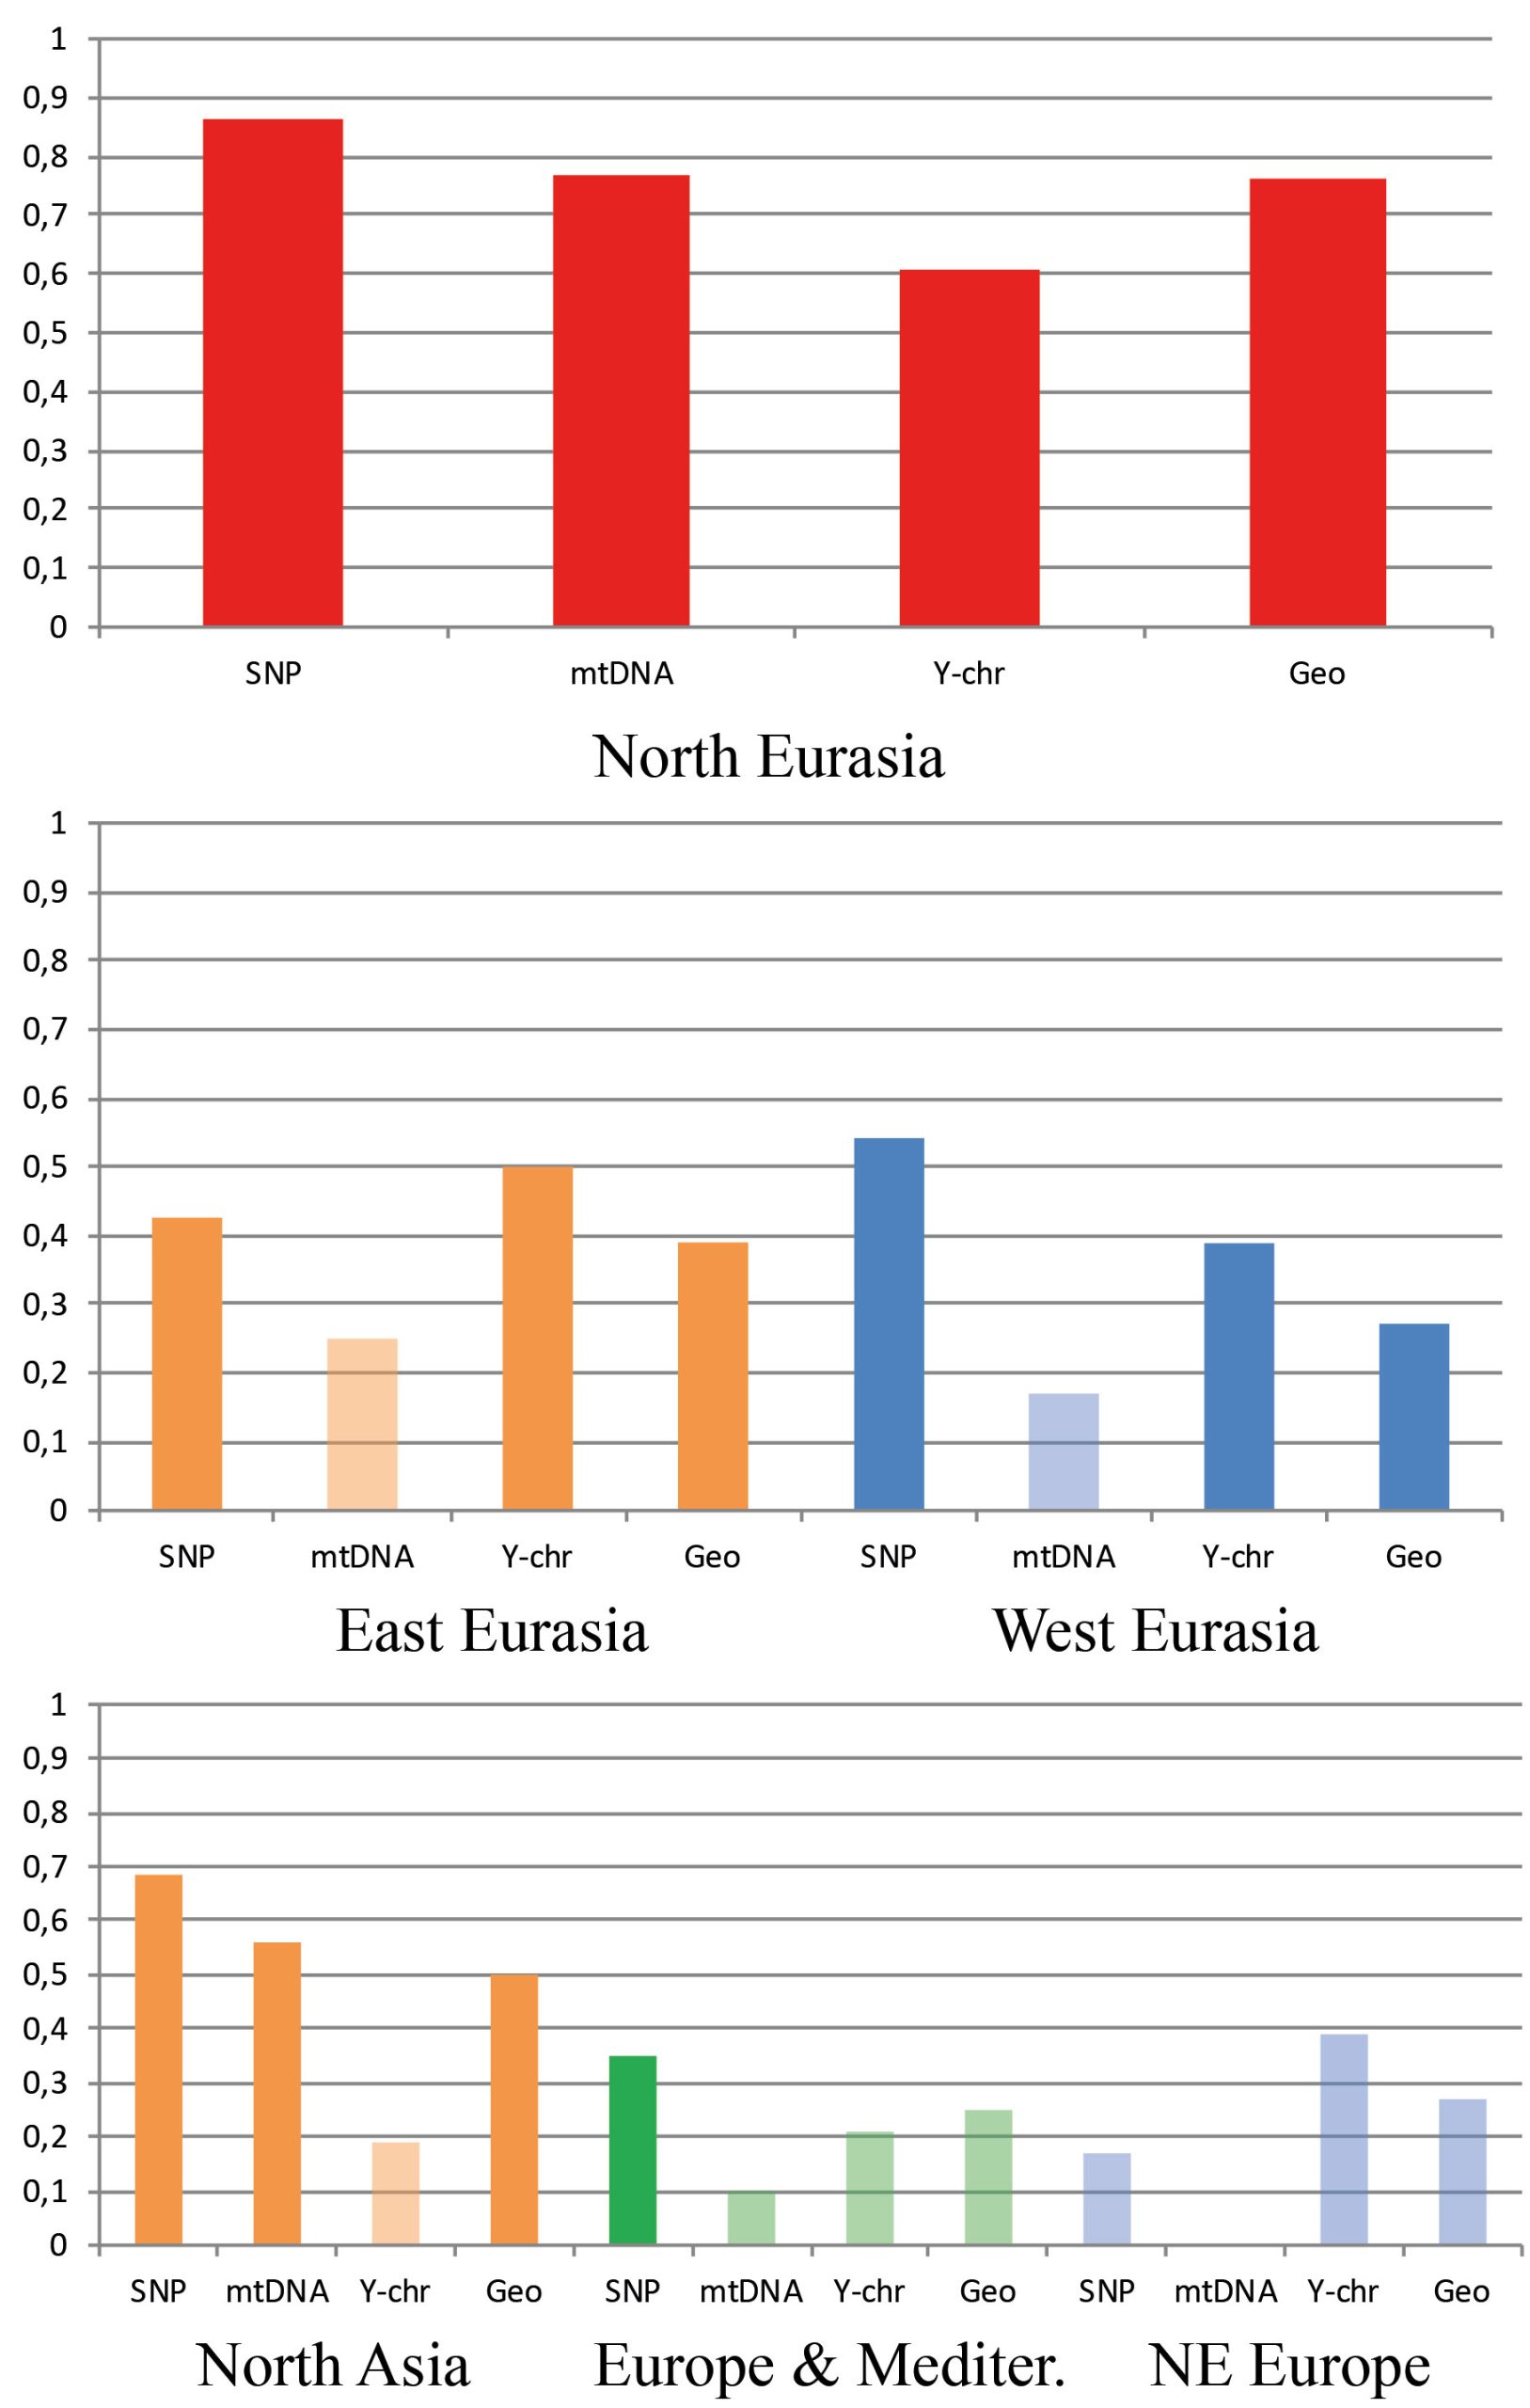
While mtDNA distances exhibit higher correlations compared to the Y-chromosome at the intercontinental level, the opposite is true in 4 out of 5 subsets at lower levels (Fig. 5). Coefficients for the mid-facial metrics (Fig. 6) are typically much higher compared to the vault. The results for the mandible are highly variable, ranging from negative to moderately high positive correlations (though not significant in most cases). The cranium in all geographical subsets displays slightly lower associations compared to the mid-face alone.
The results of the Dow-Cheverud tests for the continental scales show that the difference between the mid-face and vault at this level only applies to West Eurasia (Dow-Cheverud r = 0.326, p = 0.004) but not to East Eurasia (Dow-Cheverud r = 0.305, p = 0.074). At the regional scales, the mid-face was significantly more associated with genomic variation only at the North Asian scale (Dow-Cheverud r = 0.393, p = 0.045).
Discussion
The values of the Mantel test coefficients obtained in this study for the intercontinental (North Eurasian) level are moderate to high, which is fully consistent with previous findings at the global level. Some of the coefficients are among the highest published so far. At this level, all the systems of genetic markers employed, as well as geographic distances, display similar results. However, autosomal SNP distances exhibit the strongest associations with cranial morphology in almost all geographical scales and at all levels. This is a predictable result considering that the mode of inheritance of SNPs and cranial morphological traits is similar: numerous loci spread throughout the genome, no sex linkage, relatively low mutation rate, etc. (Lynch 1989; Weaver 2011; Aime et al. 2015 ). Local variation of the association of cranial morphology with uniparental markers can, in turn, potentially reveal interesting stories about population history when considered against a “background” of autosomal data. For instance, in 4 out of 6 geographical scales Y-chromosome distances are more correlated with cranial morphology than mtDNA distances. We hypothesize that this result might be due, at least in part, to sex-biased migration patterns in different regions of Eurasia. Thus, this and other demographic factors may account for the differential association of craniometric diversity and sex-inherited genetic diversity. In order to further test these inferences using craniometrics, sampling crania of the female sex for the same populations would be necessary. In our opinion, simultaneous use of different systems of genetic markers in craniometric-genetic association studies can provide the most detailed picture of population history, as has been advocated in previous work (Herrera et al. 2014; Evteev and Movsesian 2016). Nevertheless, if only one type of markers is to be used, for instance as a control for population history or phylogeny, the preference, according to our results, should be given to autosomal data.
The results of our study confirm finds of previous works showing that the level of association between craniometric and genetic distances depends on the part of the skull quantified and on the set of variables employed. In general, this association is higher for the mid-face than for the cranial vault in all geographical levels across North Eurasia, as observed by the absolute Mantel test correlation values. The Dow-Cheverud test further showed that this difference is significant at the intercontinental scale, as well as at the West Eurasia and North Asia scales. This is despite the well-established associations of facial shape with climatic conditions in Eurasia (see Evteev et al. 2017 for a review). Importantly, previous work (Howells 1989; Betti et al. 2009) arrived at very similar conclusions for large worldwide datasets. The higher correlations observed for mid-facial traits compared to the vault are not completely unexpected since a number of studies show that the vault is a rather volatile structure which can change rapidly under the influence of a number of factors (Alexeeva 1968; Relethford 2004b). Thus, the mid-facial region is often considered the most important area for ancestry assessment in forensic studies (e.g., Hefner 2009; Scholts et al. 2009). However, the analysis of coefficients published previously demonstrates that the strength of the association is basically identical for the face and braincase, at least at the worldwide level (but see Betti et al. 2009). Thus, the higher coefficients for the mid-facial skeleton might be specific for North Eurasia, suggesting that the cranial features that are most informative of population history or phylogeny might be found in different parts of the skull for different geographical regions.
Turning back to the analysis of literature data, our review sheds light on three primary points. First, it is clear that the cranium in general displays the strongest association with molecular genetics. The same applies to the generalized anatomical regions—face and neurocranium—compared to single bones or smaller units. The morphology of the temporal bone and basicranium do not appear more “phylogenetically relevant” than other modules. According to the same literature analysis, the lowest coefficients among all parts of the skull are typically obtained for the mandible. In the present study, the form of the mandible can display high correlations with genetic distances but these are highly variable across the geographical scales analyzed and are typically not significant. In this regard, it should be noted that sample composition in our study and others is quite different for the mandible compared to other anatomical regions, as the mandible is typically poorly presented in skull collections. Second, our review of the literature also shows that the use of linear measurements instead of landmark-based data employed in most recent works is not inferior in the strength of correlations with genomic data. This is an important observation from the point of view of studying fragmented cranial material since linear measurements can be more easily collected on fragmentary remains and in a cost-effective manner with a standard sliding caliper, in comparison to relatively costly instrumentation required for landmark data acquisition. Third, the results of some previous studies (e.g., Roseman 2004; Roseman et al. 2010; von Cramon-Taubadel 2014) show that the search for phylogenetically informative structures of the skull based on defining a priori modules might not be productive since “…environmental and genetic variation in individual traits are randomly distributed across regions of the cranium rather than being structured by developmental origin or degree of exposure to strain” (Roseman et al. 2010: 1). The use of linear measurements, which often run across different bones and cranial regions, provides an opportunity to apply a potentially more productive “module-free” approach in the search for phylogenetically important variables (see Betti et al. 2009, 2010; Roseman 2004). Likewise, existing (Roseman 2004; Betti et al. 2010; Roseman et al. 2010; Evteev et al. 2020) and novel (e.g., Rathmann and Reyes-Centeno 2020) “module-free” approaches can additionally offer an exhaustive summary of association between anatomical and molecular genetic variation under a framework that conforms to both quantitative genetics and population genetics theory.
With regard to how geography influences the association of cranial and molecular genetic variation, our results show that the correlation of the geographic distance matrices with craniometric ones is about as high as that of autosomal SNP matrices and less variable than the coefficients for uni-parental markers. This holds true for all anatomical regions and levels of comparison. However, the correlations between geographic and genetic matrices differ substantially in different geographical scales studied. Being very high in some levels, where morphological differentiation is strong and geographic distances are large (North Eurasia, North Asia), our results show that it is only moderate in other levels (West Eurasia, Europe-Mediterranean). Thus, geography can only very cautiously be used as a proxy for genetic distances, especially at local levels.
A less optimistic but important finding of this study is the fact that the strength of morphology-genetic association drops consistently and dramatically when moving from the intercontinental scale to lower geographic levels of comparison. In general, this result is expected as a result of the degree of gene flow, where populations close to each other are more likely to meet and exchange genes in comparison to populations far from each other. As such, gene flow is expected to have the immediate effect of homogenizing genetic structure in geographically proximate populations while its consequences for phenotypic variation may be much less pronounced, and this would affect the strength of association between genetic and craniometric data (Reyes-Centeno et al. 2017). Our results can also be explained by numerous confounding factors, the most apparent of which is the imperfect match between cranial and genetic samples. For example, in recent studies on the subject, genetic and morphometric data rarely come from the same individuals and often are not even from the same ethno-linguistic groups. Nevertheless, a number of studies (Hiernaux 1956; Sanghvi 1956; Friedlander et al. 1971; Rothhammer and Spielman 1972; Spielman 1973; Neel et al. 1974; Jorde, 1980; Relethford and Lees 1982) comparing somatometric variables, serological markers, and geographical distances using partially or completely overlapping samples show that even with such a study design, correlations at local levels are not high, and range from 0.17 to 0.55 (Tables S12–S13, Supplementary online material). Another factor is the inherent partial non-neutrality of cranial morphology which is, compared to neutral genetic markers, less affected by stochastic evolutionary factors like genetic drift, mutations, or founder effects. Even if morphological features are not under a direct influence of environmental factors, the need for making a functional structure makes their regulatory and protein-coding genes much more restricted in variation compared to a set of neutral genetic loci (see Lockwood et al. 2004; Weaver 2014). Interestingly, our results show that the strength of morphology-genetic association in North Asia is almost as high as that at the global level. This pattern can be explained by the fact that North Asian populations are extremely diverse in terms of cranial morphology and genetics simultaneously due to the large distances between the populations, their low population sizes, and relative isolation (Debets 1951; Jorde 1980).
Overall, our results provide a pattern that appears to be a general rule: a high level of genetic and/or morphological differentiation in a region leads to an increase of morphology-genetic correlations. Across the six regions studied, mean FST values based on autosomal markers in a region and Mantel test coefficient values between morphological and genetic distances within regions display a Spearman r correlation of 0.94 (p = 0.003). The same value for mean FST and mean Mahalanobis distance values is 0.71 (p = 0.14). Thus, the larger craniometric and genetic distances are in a region, the more similar picture of population relationship they tend to provide. As such, our results emphasize the need for investing much more effort in studying factors affecting the association between genetic and craniometric distances at different geographical scales. The strength of this association at worldwide or intercontinental levels is well established and is consistently moderate to high almost irrespectively of the variables used or the part of the skull employed. However, this firm observation can be of little practical value since in the great majority of craniometric studies, the researcher is concerned with interpopulation relationships at much lower geographic scales.
As a whole, our study has implications for the way that craniometric data is utilized in studies that aim to reconstruct the human past. We have shown that geographical scale is an important analytical factor affecting the association between genomic and cranial variation. Because the association between molecular genetic and craniometric datasets is not uniform across different geographical scales in Eurasia, studies that reconstruct population affinities or migration patterns need to explicitly consider the evolutionary forces that might differentially act across geographical space (e.g., see Hubbe, this volume, for a review on the effects of population migration events in Eurasia). Further work is also necessary in understanding how mechanisms in the past have influenced patterns of genomic and cranial variation of recent and present-day populations at different geographical scales.
Acknowledgements
The authors are grateful to the anonymous reviewer whose comments helped greatly to improve the manuscript. This work was supported by the German Research Foundation (DFG FOR 2237: Project “Words, Bones, Genes, Tools: Tracking Linguistic, Cultural, and Biological Trajectories of the Human Past”). The project was partially supported by the Russian Foundation for Basic Research (grant number 18-56-15001).
References
Aime, C., E. Heyer, and F. Austerlitz. 2015. Inference of sex-specific expansion patterns in human populations from Y-chromosome polymorphism. American Journal of Physical Anthropology 157: 217–225.
Alexeeva, T. I. 1968. Morpho-Functional population studies in some biogeochemical USSR provinces as viewed in the light of the adaptation problem. In VIIIth Intern. Congress of Anthropol. and Ethnograph. Sciences, pp. 1–11. Moscow.
Benazzo, A., A. Panziera, and G. Bertorelle. 2015. 4P: fast computing of population genetics statistics from large DNA polymorphism panels. Ecology and Evolution 5: 172–175
Betti, L., F. Balloux, W. Amos, T. Hanihara, and A. Manica. 2009. Distance from Africa, not climate, explains within-population phenotypic diversity in humans. Proceedings of the Royal Society B: Biological Sciences 276: 809–814.
Betti, L., F. Balloux, T. Hanihara, and A. Manica. 2010. The relative role of drift and selection in shaping the human skull. American Journal of Physical Anthropology 141: 76–82.
Boas, F. 1912. Changes in the bodily form of descendants of immigrants. American Anthropologist 14 (3): 530–562.
Boas, F. 1940. Changes in bodily form of descendants of immigrants. American Anthropologist 42 (2): 183–189.
Cavalli-Sforza, L. L., and A. W. F. Edwards. 1965. Analysis of human evolution. In Genetics Today. Proceeding of the XI International Congress of Genetics. Vol. 3, pp. 923–933. The Hague.
Darroch, J. N., and J. E. Mosimann. 1985. Canonical and principal components of shape. Biometrika 72: 241–252.
Debets, G. F. 1951. Anthropological researches in Kamchatskaya oblast (Proceedings of the Miklouho-Maclay Institute of Ethnography (New Series). Proceedings of the Northeastern Expedition). Moscow. [in Russian]
Dow, M. M., and J. M. Cheverud. 1985. Comparison of distance matrices in studies of population structure and genetic microdifferentiation: Quadratic assignment. American Journal of Physical Anthropology 68 (3): 367–373.
Evteev, A., A. L. Cardini, I. Morozova, and P. O’Higgins. 2014. Extreme climate, rather than population history, explains mid-facial morphology of Northern Asians. American Journal of Physical Anthropology 153: 449–462.
Evteev, A. A., and A. A. Movsesian. 2016. Testing the association between human mid-facial morphology and climate using autosomal, mitochondrial, Y chromosomal polymorphisms and cranial non-metrics. American Journal of Physical Anthropology 159: 517–522.
Evteev, A. A., A. A. Movsesian, and A. N. Grosheva. 2017. The association between mid-facial morphology and climate in Northeast Europe differs from that in North Asia: Implications for understanding the morphology of Late Pleistocene Homo sapiens. Journal of Human Evolution 107: 36–48.
Evteev, A. A., P. Santos, S. Ghirotto, and H. Reyes-Centeno. 2020. Associations between genetic differentiation and craniometric interpopulation distances across North Eurasia. American Journal of Physical Anthropology 171(S69): 82–82.
Fabra, M., and D. A. Demarchi. 2011. Geographic patterns of craniofacial variation in pre-Hispanic populations from the Southern Cone of South America. American Journal of Human Biology 83: 491–507.
Friedlander, J. S., L. A. Sgaramella-Zonta, K. K. Kidd, L. Y. C. Lai, P. Clark, and R. J. Walsh. 1971. Biological divergences in South-Central Bougainville: An analysis of blood polymorphism gene frequencies and anthropometric measurements utilizing tree models, and a comparison of these variables with linguistic, geographic, and migrational “distances.” American Journal of Human Genetics 23: 253–270.
Fu, Q., M. Meyer, X. Gao, U. Stenzel, H. A. Burbano, J. Kelso, and S. Paabo. 2013. DNA analysis of an early modern human from Tianyuan Cave, China. Proceedings of the National Academy of Science USA 110: 2223–2227.
Gonzalez-Jose, R., S. L. Dahinten, M. A. Luis, M. Hernandez, and H. M. Pucciarelli. 2001. Craniometric variation and the settlement of the Americas: Testing hypotheses by means of R-matrix and matrix correlation analyses. American Journal of Physical Anthropology 116: 154–165.
Gonzalez-Jose, R., S. Van der Molen, E. Gonzalez-Perez, and M. Hernadez. 2004. Patterns of phenotypic covariation and correlation in modern humans as viewed from morphological integration. American Journal of Physical Anthropology 123: 69–77.
Hanihara, T. 2000. Frontal and facial flatness of major human populations. American Journal of Physical Anthropology 111:105–134.
Hammer, Ø., D. A. T. Harper, and P. D. Ryan. 2001. PAST: PAlaeontological STatistics. Available at: http://folk.uio.no/ohammer/past/.
Harvati, K., and T. D. Weaver. 2006a. Human cranial anatomy and the differential preservation of population history and climate signatures. The Anatomical Record A 288: 1225–1233.
Harvati, K., and T. D. Weaver. 2006b. Reliability of cranial morphology in reconstructing Neanderthal phylogeny. In Neanderthals Revisited: New Approaches and Perspectives, ed. by J-J. Hublin, K. Harvati, and T. Harrison, pp. 239–254. Dordrecht: Springer. Hefner, J. T. 2009. Cranial nonmetric variation and estimating ancestry. Journal of Forensic Sciences 54 (5): 985–995.
Herrera, B., T. Hanihara, and K. Godde. 2014. Comparability of multiple data types from the Bering strait region: cranial and dental metrics and nonmetrics, mtDNA, and Y-chromosome DNA. American Journal of Physical Anthropology 154: 334–348.
Hiernaux, J. 1956. Analyse de la variation de characteres physiques humains en une region de l’Afrique centrale: Ruanda-Urundi et Kivu (Annales du Musee Royal du Congo Belge. Science de l’homme. Ser. in 8o, V. 3). Tervuren.
Howells, W. W. 1989. Skull shapes and the map. Cambridge: Peabody Museum Press.
Hubbe, M. 2020. The structure of cranial morphological variance in Asia: Implications for the study of modern human dispersion across the planet. In Ancient Connections in Eurasia, ed. by H. Reyes-Centeno and K. Harvati. DFG Center for Advanced Studies Series. Tübingen: Kerns Verlag.
Hubbe, M., T. Hanihara, and K. Harvati. 2009. Climate signatures in the morphological differentiation of worldwide modern human populations. The Anatomical Record A 292:1720–1733.
Hubbe, M., W. A. Neves, and K. Harvati. 2010. Testing evolutionary and dispersion scenarios for the settlement of the New World. PLoS ONE 5(6):e11105.
Hubbe, M., K. Harvati, and W. Neves. 2011. Paleoamerican morphology in the context of European and East Asian Late Pleistocene variation: Implications for human dispersion into the New World. American Journal of Physical Anthropology 144: 442–453.
Hubbe, M., M. Okumura, D. V. Bernardo, and W. A. Neves. 2014. Cranial morphological diversity of Early, Middle, and Late Holocene Brazilian groups: Implications for human dispersion in Brazil. American Journal of Physical Anthropology 155: 546–558.
Jorde, L. B. 1980. The genetic structure of subdivided human populations: A review. In Current Developments in Anthropological Genetics. V.1 Theory and Methods, ed. by M. H. Crawford and J. H. Mielke, pp. 135–208. New York: Plenum Press.
Lalueza Fox, C., M. Hernandez, and C. Garcia Moro. 1996. Craniometric analysis in groups from Tierra del Fuego/Patagonia and the peopling of the south extreme of the Americas. Human Evolution 11: 217–224.
Lockwood, C. A., W. H. Kimbel, and J. M. Lynchd. 2004. Morphometrics and hominoid phylogeny: support for a chimpanzee–human clade and differentiation among great ape species. Proceedings of the National Academy of Science USA 101:4356–4360.
Lynch, M. 1989. Phylogenetic hypotheses under the assumption of neutral quantitative-genetic variation. Evolution 43 (1):1-17.
Maley, B.C. 2011. Population structure and demographic history of human Arctic populations using quantitative cranial traits. PhD dissertation. Washington University in St. Louis.
Moiseyev, V. G., and C. de la Fuente. 2016. Population history of indigenous peoples of Siberia: Integrating of anthropological and genetic data. Tomsk State University Journal of History 5: 158–163.
Neel, J. V., F. Rothhammer, and J. C. Lingoes. 1974. The genetic structure of a tribal population, the Yanomama Indians. X. Agreement between representations of village distances based on different sets of characteristics. American Journal of Human Genetics 26: 281–303.
Nicholson, E., and K. Harvati. 2006. Quantitative analysis of human mandibular shape using three-dimensional geometric morphometrics. American Journal of Physical Anthropology 131: 368–683.
Noback, M. L., and K. Harvati. 2015. The contribution of subsistence to global human cranial variation. Journal of Human Evolution 80: 34–50.
Ramachandran, S., O. Deshpande, C. C. Roseman, N. A. Rosenberg, M. W. Feldman, and L. L. Cavalli-Sforza. 2005. Support from the relationship of genetic and geographic distance in human populations for a serial founder effect originating in Africa. Proceedings of the National Academy of Sciences USA 102 (44): 15942–15947.
Reich, D., N. Patterson, D. Campbell, et al. 2012. Reconstructing Native American population history. Nature 488: 370–374.
Relethford, J. H., and H. C. Harpending. 1994. Craniometric variation, genetic theory, and modern human origins. American Journal of Physical Anthropology 95 (3): 249–270.
Relethford, J. H., and F. C. Lees. 1982. The use of quantitative traits in the study of human population structure. Yearbook of Physical Anthropology 25: 113–132.
Relethford, J. H. 2004a. Global patterns of isolation by distance based on genetic and morphological data. Human Biology 76 (4): 499–513.
Relethford, J. H. 2004b. Boas and beyond: Migration and craniometric variation. American Journal of Human Biology 16: 379–386.
Rathmann, H., and H. Reyes-Centeno. 2020. Testing the utility of dental morphological trait combinations for inferring human neutral genetic variation. PNAS 117 (20): 10769–10777.
Reyes-Centeno, H. 2016. Out of Africa and into Asia: Fossil and genetic evidence on modern human origins and dispersals. Quaternary International 416: 249–262.
Reyes-Centeno, H., S. Ghirotto, F. Détroit, D. Grimaud-Hervéc, G. Barbujani, and K. Harvati. 2014. Genomic and cranial phenotype data support multiple modern human dispersals from Africa and a southern route into Asia. Proceedings of the National Academy of Science USA 111: 7248–7253.
Reyes-Centeno, H., K. Harvati, and G. Jäger. 2016. Tracking modern human population history from linguistic and cranial phenotype. Scientific Reports 6 (1): 36645.
Reyes-Centeno, H., M. Hubbe, T. Hanihara, C. Stringer, and K. Harvati. 2015. Testing modern human out-of-Africa dispersal models and implications for modern human origins. Journal of Human Evolution 87: 95–106.
Reyes-Centeno, H., S. Ghirotto, and K. Harvati. 2017. Genomic validation of the differential preservation of population history in modern human cranial anatomy. American Journal of Physical Anthropology 162: 170–179.
Ricaut, F. X., V. Auriol, N. von Cramon-Taubadel, C. Keyser, P. Murail, B. Ludes, and E. Crubezy. 2010. Comparison between morphological and genetic data to estimate biological relationship: The case of the Egyin Gol necropolis (Mongolia). American Journal of Physical Anthropology 143: 355–364.
Roseman, C. C. 2004. Detecting interregionally diversifying natural selection on modern human cranial form by using matched molecular and morphometric data. Proceedings of the National Academy of Science USA 101: 12824–12829.
Roseman, C. C., K. E. Willmore, J. Rogers, C. Hildebolt, B. E. Sadler, J. T. Richtsmeier, and J. M. Cheverud. 2010. Genetic and environmental contributions to variation in baboon cranial morphology. American Journal of Physical Anthropology 143: 1–12.
Rothhammer, F., and R. S. Spielman. 1972. Anthropometric variation in the Aymará: Genetic, geographic, and topographic contributions. American Journal of Human Genetics 24: 371–380.
Rothhammer, F., and C. Silva. 1990. Craniometrical variation among South American prehistoric populations: Climatic, altitudinal, chronological, and geographic contributions. American Journal of Physical Anthropology 82: 9–17.
Sanghvi, L. D. 1953. Comparison of genetical and morphological methods for a study of biological difference. American Journal of Physical Anthropology 11: 385–404.
Sholts, S. B., P. L. Walker, S. C. Kuzminsky, K. W. P. Miller, and S. K. T. S. Wärmländer. 2011. Identification of group affinity from cross-sectional contours of the human midfacial skeleton using digital morphometrics and 3D laser scanning technology. Journal of Forensic Science 56 (2): 333–338.
Smith, H. F., C. E. Terhune, and C. A. Lockwood. 2007. Genetic, geographic, and environmental correlates of human temporal bone variation. American Journal of Physical Anthropology 134: 312–322.
Smith, H. F. 2009. Which cranial regions reflect molecular distances reliably in humans? Evidence from three-dimensional morphology. American Journal of Human Biology 21: 36–47.
Smith, H. F., B. I. Hulsey, F. L. West (Pack), and G. S. Cabana. 2016. Do biological distances reflect genetic distances? A comparison of craniometric and genetic distances at local and global scales. In Biological Distance Analysis: Forensic and Bioarchaeological Perspectives, ed. by M. A. Pilloud and J. T. Hefner, pp. 157–179. Elsevier Science.
Sparks, C. S. and R. L. Jantz. 2002. A reassessment of human cranial plasticity: Boas revisited. Proceedings of the National Academy of Sciences 99 (23): 14636–14639.
Spielman, R. S. 1973. Differences among Yanomama Indian villages: Do the patterns of allele frequencies, anthropometrics and map locations correspond? American Journal of Physical Anthropology 39: 461–480.
Tambets, K., S. Rootsi, T. Kivisild, et al. 2004. The Western and Eastern roots of the Saami—the story of genetic “outliers” told by mitochondrial DNA and Y chromosomes. American Journal of Human Genetics 74: 661–682.
von Cramon-Taubadel, N. 2009a. Congruence of individual cranial bone morphology and neutral molecular affinity patterns in modern humans. American Journal of Physical Anthropology 140: 205–215.
von Cramon-Taubadel, N. 2009b. Revisiting the homoiology hypothesis: The impact of phenotypic plasticity on the reconstruction of human population history from craniometric data. Journal of Human Evolution 57: 179–190.
von Cramon-Taubadel, N. 2011a. The relative efficacy of functional and developmental cranial modules for reconstructing global human population history. American Journal of Physical Anthropology 146: 83–93.
von Cramon-Taubadel, N. 2011b. Global human mandibular variation reflects differences in agricultural and hunter-gatherer subsistence strategies. Proceedings of the National Academy of Science USA 108: 19546–19551.
von Cramon-Taubadel, N., J. T. Stock, and R. Pinhasi. 2013. Skull and limb morphology differentially track population history and environmental factors in the transition to agriculture in Europe. Proceedings of the Royal Society B 280: 20131337.
von Cramon-Taubadel, N. 2014. Evolutionary insights into global patterns of human cranial diversity: Population history, climatic and dietary effects. Journal of Anthropological Sciences 92: 43–77.
von Cramon-Taubadel, N., and S. J. Lycett. 2014. A comparison of catarrhine genetic distances with pelvic and cranial morphology: Implications for determining hominin phylogeny. Journal of Human Evolution 77: 179–186.
von Cramon-Taubadel, N. 2016. Population biodistance in global perspective: Assessing the influence of population history and environmental effects on patterns of craniomandibular variation. In Biological Distance Analysis: Forensic and Bioarchaeological Perspectives, ed. by M. A. Pilloud and J. T. Hefner, pp. 425–446. Elsevier Science.
Weaver, T. D. 2011. Rates of cranial evolution in Neandertals and Modern Humans. In Computational Paleontology, ed. by A. M. T. Elewa, pp. 165–178. Berlin, Heidelberg: Springer Berlin Heidelberg.
Weaver, T. D. 2014. Brief communication: Quantitative and molecular-genetic differentiation in humans and chimpanzees: Implications for the evolutionary processes underlying cranial diversification. American Journal of Physical Anthropology 154: 615–620.
Weir, B. S., and C. C. Cockerham. 1984. Estimating F-statistics for the analysis of population structure. Evolution 38: 1358–1370.
Weisensee, K. E. 2013. Exploring the relative importance of spatial and environmental variation on the craniometrics of the modern Portuguese. Human Biology 85(5): 673–686.
Appendix: Supplementary tables S1–S5
References
Alekseev, V. P., and G. F. Debets. 1964. Kraniometria. Metodika anthropologitsheskh isledovaniy. Izd. Nauka, Moskva.
Evteev, A. A., A. A. Movsesian, and A. N. Grosheva. 2017. The association between midfacial morphology and climate in northeast Europe differs from that in north Asia: Implications for understanding the morphology of Late Pleistocene Homo sapiens. Journal of Human Evolution 107: 36–48.
Howells, W. W. 1989. Skull shapes and the map. Cambridge: Peabody Museum Press.
Martin, R. 1928. Lehrbuch der Anthropologie in Systematischer darstellung. 2-e Bd. Kraniologie. Osteologie. Jena.
References
Altshuler, D. M., R. A. Gibbs, L. Peltonen, E. Dermitzakis, S. F. Schaffner, F. Yu, P. E. Bonnen, P. I. W. de Bakker, et al. 2010. Integrating common and rare genetic variation in diverse human populations. Nature 467 (7311): 52–58.
Auton, A., G. R. Abecasis, D. M. Altshuler, R. M. Durbin, D. R. Bentley, A. Chakravarti, et al. 2015. A global reference for human genetic variation. Nature 526 (7571): 68–74.
Nelson, M. R., K. Bryc, K. S. King, A. Indap, A. R. Boyko, J. Novembre, et al. 2008. The population reference sample, POPRES: A resource for population, disease, and pharmacological genetics research. The American Journal of Human Genetics 83 (3): 347–358.
Lazaridis, I., N. Patterson, A. Mittnik, G. Renaud, S. Mallick, K. Kirsanow, P. H. Sudmant, J. G. Schraiber, S. Castellano, M. Lipson, B. Berger, C. Economou, R. Bollongino, et al. 2014. Ancient human genomes suggest three ancestral populations for present-day Europeans. Nature 513 (7518): 409–413.
López Herráez, D., M. Bauchet, K. Tang, C. Theunert, I. Pugach, J. Li, M.R. Nandineni, A. Gross, M. Scholz, and M. Stoneking. 2009. Genetic variation and recent positive selection in worldwide human populations: Evidence from nearly 1 million SNPs. PLOS ONE 4(11): e7888.
Xing, J., W. S. Watkins, D. J. Witherspoon, Y. Zhang, S. L. Guthery, R. Thara, B. J. Mowry, K. Bulayeva, R. B. Weiss, and L. B. Jorde. 2009. Fine-scaled human genetic structure revealed by SNP microarrays. Genome Research 19 (5): 815–825.
Xing, Jinchuan, W. Scott Watkins, Adam Shlien, Erin Walker, Chad D. Huff, David J. Witherspoon, Yuhua Zhang, Tatum S. Simonson, Robert B. Weiss, Joshua D. Schiffman, David Malkin, Scott R. Woodward, and Lynn B. Jorde. 2010. Toward a more uniform sampling of human genetic diversity: A survey of worldwide populations by high-density genotyping. Genomics 96 (4): 199–210.
References
Auton, A., G. R. Abecasis, D. M. Altshuler, R. M. Durbin, D. R. Bentley, A. Chakravarti, et al. 2015. A global reference for human genetic variation. Nature 526(7571): 68–74.
Hellenthal, G., G. B. J. Busby, G. Band, J. F. Wilson, C. Capelli, D. Falush, and S. Myers. 2014. A genetic atlas of human admixture history. Science 343 (6172): 747–751.
Leu, M., K. Humphreys, I. Surakka, E. Rehnberg, J. Muilu, P. Rosenström, P. Almgren, J. Jääskeläinen, R. P. Lifton, K. Ohm Kyvik, J. Kaprio, N. L. Pedersen, A. Palotie, P. Hall, H. Grönberg, L. Groop, L. Peltonen, J. Palmgren, and S. Ripatti. 2010. NordicDB: a Nordic pool and portal for genome-wide control data. European Journal of Human Genetics 18 (12): 1322–1326.
Yunusbayev, B., M.Metspalu, M. Järve, I. Kutuev, S. Rootsi, E. Metspalu, D. M. Behar, K.Varendi, H. Sahakyan, R. Khusainova, L. Yepiskoposyan, E. K. Khusnutdinova, P. A. Underhill, T. Kivisild, and R. Villems. 2012. The Caucasus as an asymmetric semipermeable barrier to ancient human migrations. Molecular Biology and Evolution 29 (1): 359–365.
Yunusbayev, B., M. Metspalu, E. Metspalu, A. Valeev, S. Litvinov, R. Valiev, V. Akhmetova, E. Balanovska, O. Balanovsky, S. Turdikulova, D. Dalimova, P. Nymadawa, A. Bahmanimehr, H. Sahakyan, K. Tambets, S. Fedorova, N. Barashkov, I. Khidiyatova, E. Mihailov, R. Khusainova, L. Damba, M. Derenko, B. Malyarchuk, L. Osipova, M. Voevoda, L. Yepiskoposyan, T. Kivisild, E. Khusnutdinova, and R. Villems. 2015. The genetic legacy of the expansion of Turkic-speaking nomads across Eurasia. PLOS Genetics 11 (4):e1005068.
References
Batini, C., P. Hallas, D. Zadik, P. M. Delser, A. Benazzo, S. Ghirotto, E. Arroyo-Pardo, G. L. Cavalleri, P. de Knijff, B. M. Dupuy, H. A. Eriksen, T. E. King, A. L. de Munain, A. M. López-Parra, A. Loutradis, J. Milasin, A. Novelletto, H. Pamjay, A. Sajantila, A. Tolun, B. Winney, and M. A. Jobling. 2015. Large-scale recent expansion of European patrilineages shown by population resequencing. Nature Communications 6: 7152.
Bermisheva, M., K. Tambets, R. Villems, and A. E. Khusnutdinova. 2002. Diversity of mitochondrial DNA haplotypes in ethnic populations of the Volga-Ural region of Russia. Molecular Biology (Russian) 36(6): 990–1001.
Bosch, E., F. Calafell, A. González-Neira, C. Flaiz, E. Mateu, H.-G. Scheil, W. Huckenbeck, L. Efremovska, I. Mikerezi, N. Xirotiris, C. Grasa, H. Schmidt, and D. Comas. 2006. Paternal and maternal lineages in the Balkans show a homogenous landscape over linguistic barriers, except for the isolated Aromuns. Annals of Human Genetics 70: 459–487.
Coia, V., M. Capocasa, P. Anagnostou, V. Pascali, F. Scarnicci, I. Boschi, C. Battaggia, F. Crivellaro, G. Ferri, M. Alù, F. Brisighelli, G. B. J. Busby, C. Capelli, F. Maixner, G. Cipollini, P. P. Viazzo, A. Zink, and G. Destro Bisol. 2013. Demographic histories, isolation and social factors as determinants of the genetic structure of alpine linguistic groups. PLoS ONE 8(12): e81704. doi:10.1371/journal.pone.008170
Crawford, M., R. C. Rubicz, and M. Zlojutro. 2010. Origins of Aleuts and the genetic structure of populations of the archipelago: Molecular and archaeological perspectives. Human Biology 82(5-6): 695–717.
Dupuy B. M., M. Stenersen, T. T. Lu, and B. Olaisen. 2006. Geographical heterogeneity of Y-chromosomal lineages in Norway. Forensic Science International 164(1):10-9
Fechner, A., D. Quinque, S. Rychov, I. Morozowa, O. Naumova, Y. Schnieder, S. Willuweit, O. Zhukova, L. Roewer, M. Stoneking, and I. Nasidze. 2008. Boundaries and clines of the west Eurasian Y-chromosome landscape: Insights from the European part of Russia. American Journal of Physical Anthropology 137: 41–47.
Heinrich, M., T. Braun, T. Sanger, P. Saukko, S. Lutz-Bonengel, and U. Schmidt. 2009. Reduced-volume and low-volume typing of Y-chromoisomal SNPs to obtain Finnish Y-chromosomal compound haplotypes. International Journal of Legal Medicine 123: 413–418.
Ingman, M., and U. Gyllensten. 2007. A recent genetic link between Sami and the Volga-Ural region of Russia Europ. Journal of Human Genetics 15: 115–120.
Jankova-Ajanovska, R., B. Zimmermann, G. Huber, A. W. Röck, M. Bodner, Z. Jakovski, B. Janeska, A. Duma, and W. Parson. 2014. Mitochondrial DNA control region analysis of three ethnic groups in the Republic of Macedonia. Genetics 13: 1–2.
Jin, H-J, C. Tyler-Smith, and W. Kim. 2009. The peopling of Korea revealed by analyses of mitochondrial DNA and Y-chromosomal markers. PLoS ONE 4(1): e4210. https://doi.org/10.1371/journal.pone.0004210
Karachanak, S., V. Carossa, D. Nesheva, A. Olivieri, M. Pala, B. H. Kashani, V. Grugni, V. Battaglia, A. Achilli, Y. Yordano, A. S. Galabov, O. Semino, D. Toncheva, and A. Torroni. 2011. Bulgarians vs the other European populations: A mitochondrial DNA perspective. International Journal of Legal Medicine. doi: 10.1007/s00414-011-0589-y
Kutuev, I. A. 2010. Geneticheskaya struktura i philogeografiya narodov Kavkaza (Genetic structure and phylogeography of peoples of the Caucasus). Doctor of Science Dissertation, Ufa. Institute of biochemistry and genetics of the Ufa scientific centre of Russian Academy of Science.
Lappalainen, T., S. Koivumaki, E. Salmela, K. Huoponen, P. Sistonen, M.-L. Savontaus, and P. Lahermo. 2006. Regional differences among the Finns: A Y-chromosomal perspective. Gene 376: 207–215.
Lappalainen, T., V. Laitinen, E. Salmela, P. Andersen, K. Huoponen, M.-L. Savontaus, and P. Lahermo. 2008. Migration waves to the Baltic Sea region. Annals of Human Genetics 72: 337–348.
Lell J. T., R. I. Sukernik, Y. B. Starikovskaya, B. Su, L. Jin, T. G. Schurr, P. A. Underhill, and D. C. Wallace. 2002. The dual origin and Siberian affinities of Native American Y chromosomes. American Journal of Human Genetics 70(1): 192–206. doi: 10.1086/338457
Malyarchuk, B. A., M. V. Derenko, T. Grzybowski, A. Lunkina, J. Czarny, S. Rychkov, I. Morozova, G. Denisova, and D. Miscicka-Sliwka. 2004. Differentiation of mitochondrial DNA and Y-chromosomes in Russian populations. Human Biology 76(6): 877–900.
Malyarchuk, B. A., and M. V. Derenko. 2008. Gene pool structure of Russian populations from the European part of Russia inferred from the data on Y-chromosome haplogroups distribution. Russian Journal of Genetics 44 (2C): 187–192.
Meinila, M., S. Finnila, and K. Majamaa. 2001. Evidence for mtDNA admixture between the Finns and the Saami. Human Heredity 52(3): 160–170.
Mielnik-Sikorska, M., P. Daca, M. Wozniak, B. A. Malyarchuk, J. Bednarek, T. Dobosz, and T. Grzybowski. 2013. Genetic data from Y-chromosome STR and SNP loci in Ukrainian population. Genetics 7: 200–203.
Mirabal, S., M. Regueiro, A. M. Cadenas, L. L. Cavalli-Sforza, P. A. Underhill, D. A. Verbenko, S. A. Limborska, and R. J. Herrera. 2009. Y-chromosome distribution within the geo-linguistic landscape of northwestern Russia. European Journal of Human Genetics 17: 1260–1273.
Morozova, I., A. Evsyukov, A. Kon’kov, A. Grosheva, O. Zhukova, and S. Rychov. 2012. Russian ethnic history inferred from mitochondrial DNA diversity. American Journal of Physical Anthropology 147: 341–351.
Osipova, L.P. 2005. Korennoe naselenie Shuryshkarskogo rayona Yamalo-Nenetskogo avtonomnogo okruga: demographicheskie, geneticheskie i meditsinskie aspekty (Indigenous population of Shuryshkarsky district of Yanalo-Nenetsky autonomous okrug: demographic, genetic and medical aspects). ART–AVENUE, Novosibirsk.
Pakendorf, B., V. Wiebe, L. A. Tarskaia, V. A. Spitsyn, H. Soodyall, A. Rodewald, and M. Stoneking. 2003. Mitochondrial DNA evidence for admixed origins of central Siberian populations. American Journal of Physical Anthropology 120(3): 211–24.
Passarino, G., G. L. Cavalleri, A. A. Lin, L. L. Cavalli-Sforza, A.-L. Børresen-Dale, and P. A. Underhill. 2002. Different genetic components in the Norwegian population revealed by the analysis of mtDNA and Y-chromosome polymorphisms. European Journal of Human Genetics 10: 521–529.
Pimenoff ,V.N., D. Comas, J. U. Palo, G. Vershubsky, A. Kozlov, and A. Sajantila. 2008. Northwest Siberian Khanty and Mansi in the junction of West and East Eurasian gene pools as revealed by uniparental markers. European Journal of Human Genetics 16: 1254–1264.
Pliss, L., L. Timša, S. Rootsi, K. Tambets, I. Pelnena, E. Zole, A. Puzuka, A. Sabule, S. Rozane, B. Lace, V. Kucinskas, A. Krumina, R. Ranka, and V. Baumanis. 2015. Y-chromosomal lineages of Latvians in the context of the genetic variation of the eastern Baltic Region. Annals of Human Genetics 79: 418–430.
Pshenichnov, A., O. Balanovsky, O. Utevska, E. Metspalu, V. Zaporozhchenko, A. Agdzhoyan, M. Churnosov, L. Atramentova, and E. Balanovska. 2013 Genetic affinities of Ukrainians from the maternal perspective. American Journal of Physical Anthropology 152(4): 543–550.
Quintana-Murci, L., R. Chaix, R. S. Wells, D. M. Behar, H. Sayar, R. Scozzari, C. Rengo, N. Al-Zahery, O. Semino, A. S. Santachiara-Benerecetti, A. Coppa, Q. Ayub, A. Mohyuddin, C. Tyler-Smith, S. Q. Mehdi, A. Torroni, and K. McElreavey. 2004. Where west meets east: The complex mtDNA landscape of the southwest and Central Asian corridor. American Journal of Human Genetics 74(5): 827–845.
Raff, J.A., M. Rzhetskaya, J. Tackney, and M. G. Hayes. 2015. Mitochondrial diversity of Iñupiat people from the Alaskan North Slope provides evidence for the origins of the Paleo- and Neo-Eskimo peoples. American Journal of Physical Anthropology 157(4): 603–14. doi: 10.1002/ajpa.22750. Epub 2015 Apr 17.
Richards, M., H. Côrte-Real, P. Forster, V. Macaulay, H. Wilkinson-Herbots, A. Demaine, S. Papiha, R. Hedges, H. J. Bandelt, and B. Sykes. 1996. Paleolithic and neolithic lineages in the European mitochondrial gene pool. American Journal of Human Genetics 59(1): 185–203.
Richards, M., V. Macaulay, E. Hickey, E. Vega, B. Sykes, V. Guida, C. Rengo, D. Sellitto, F. Cruciani, et al. 2000. Tracing European founder lineages in the Near Eastern mtDNA pool. American Journal of Human Genetics 67(5): 1251–1276.
Rienzo, A. D., and A. C. Willson. 1991. Branching pattern in the evolutionary tree for human mitochondrial DNA. Proceedings of the National Academy of Science USA 88(5): 1597–1601.
Rubicz, R., M. Zlojutro, G. Sun, V. Spitsyn, R. Deka, K. L. Young, and M. H. Crawford. 2010. Genetic architecture of a small, recently aggregated Aleut population: Bering Island, Russia. Human Biology 82(5/6): 719-36. https://doi.org/10.3378/027.082.0512
Shlush, L. I., D. M. Behar, G. Yudkovsky, A. Templeton, Y. Hadid, F. Basis, M. Hammer, S. Itzkovitz, and K. Skorecki. 2008. The Druze: A population genetic refugium of the Near East. PLoS One 3(5): e2105.
Starikovskaya, Y.B., R. I. Sukernik, T. G. Schurr, A. M. Kogelnik, and D. C. Wallace. 1998. mtDNA diversity in Chukchi and Siberian Eskimos: implications for the genetic history of Ancient Beringia and the peopling of the New World. American Journal of Human Genetics 63(5): 1473-91. doi: 10.1086/302087. PubMed PMID: 9792876
Sukernik, R. I., N. V. Volodko, I. O. Mazunin, N. P. Eltsov, S. V. Dryomov, and E. B. Starikovskaya. 2012. Mitochondrial genome diversity in the Tubalar, Even, and Ulchi: Contribution to prehistory of native Siberians and their affinities to Native Americans. American Journal of Physical Anthropology 148(1): 123–38. doi: 10.1002/ajpa.22050. Epub 2012 Apr 4.
Tambets, K., S. Rootsi, T. Kivisild, H. Help, P. Serk, E. L. Loogväli, H. V. Tolk, et al. 2004. The western and eastern roots of the Saami–the story of genetic “outliers” told by mitochondrial DNA and Y chromosomes. American Journal of Human Genetics 74(4): 661–82. doi: 10.1086/383203
Trofimova, N.V. 2015. Izmenchivost’ mitokhondrial’noy DNK and Y-khromosomy v populiatsiyakh volgo-uralskogo regiona (The mtDNA and Y-chromosome diversity in populations of Volga-Ural region). Ph.D. Dissertation, Ufa. Institute of Biochemistry and Genetics of the Ufa Scientific Centre of Russian Academy of Sciences. [In Russian]
Zalloua, P. A., Y. Xue, J. Khalife, N. Makhoul, L. Debiane, D. E. Platt, A. K. Royyuru, R. J. Herrera, D. F. S. Hernanz, J. Blue-Smith, R. S. Wells, D. Comas, J. Bertranpetit, C. Tyler-Smith, The Genographic Consortium. 2008. Y-chromosomal diversity in Lebanon is structured by recent historical events. American Journal of Human Genetics 82: 873–882.